The digital electricity advisor has 3 different analytics to help you keep an eye on your consumption.
- Baseload
- Peak
- Activity
In order to perform the analysis, Ento includes many different parameters in the calculations. At the top you have an overview of your total consumption. You can choose to view this on an hourly, daily, monthly or yearly basis. Here, you also get more details under Models and Performance.
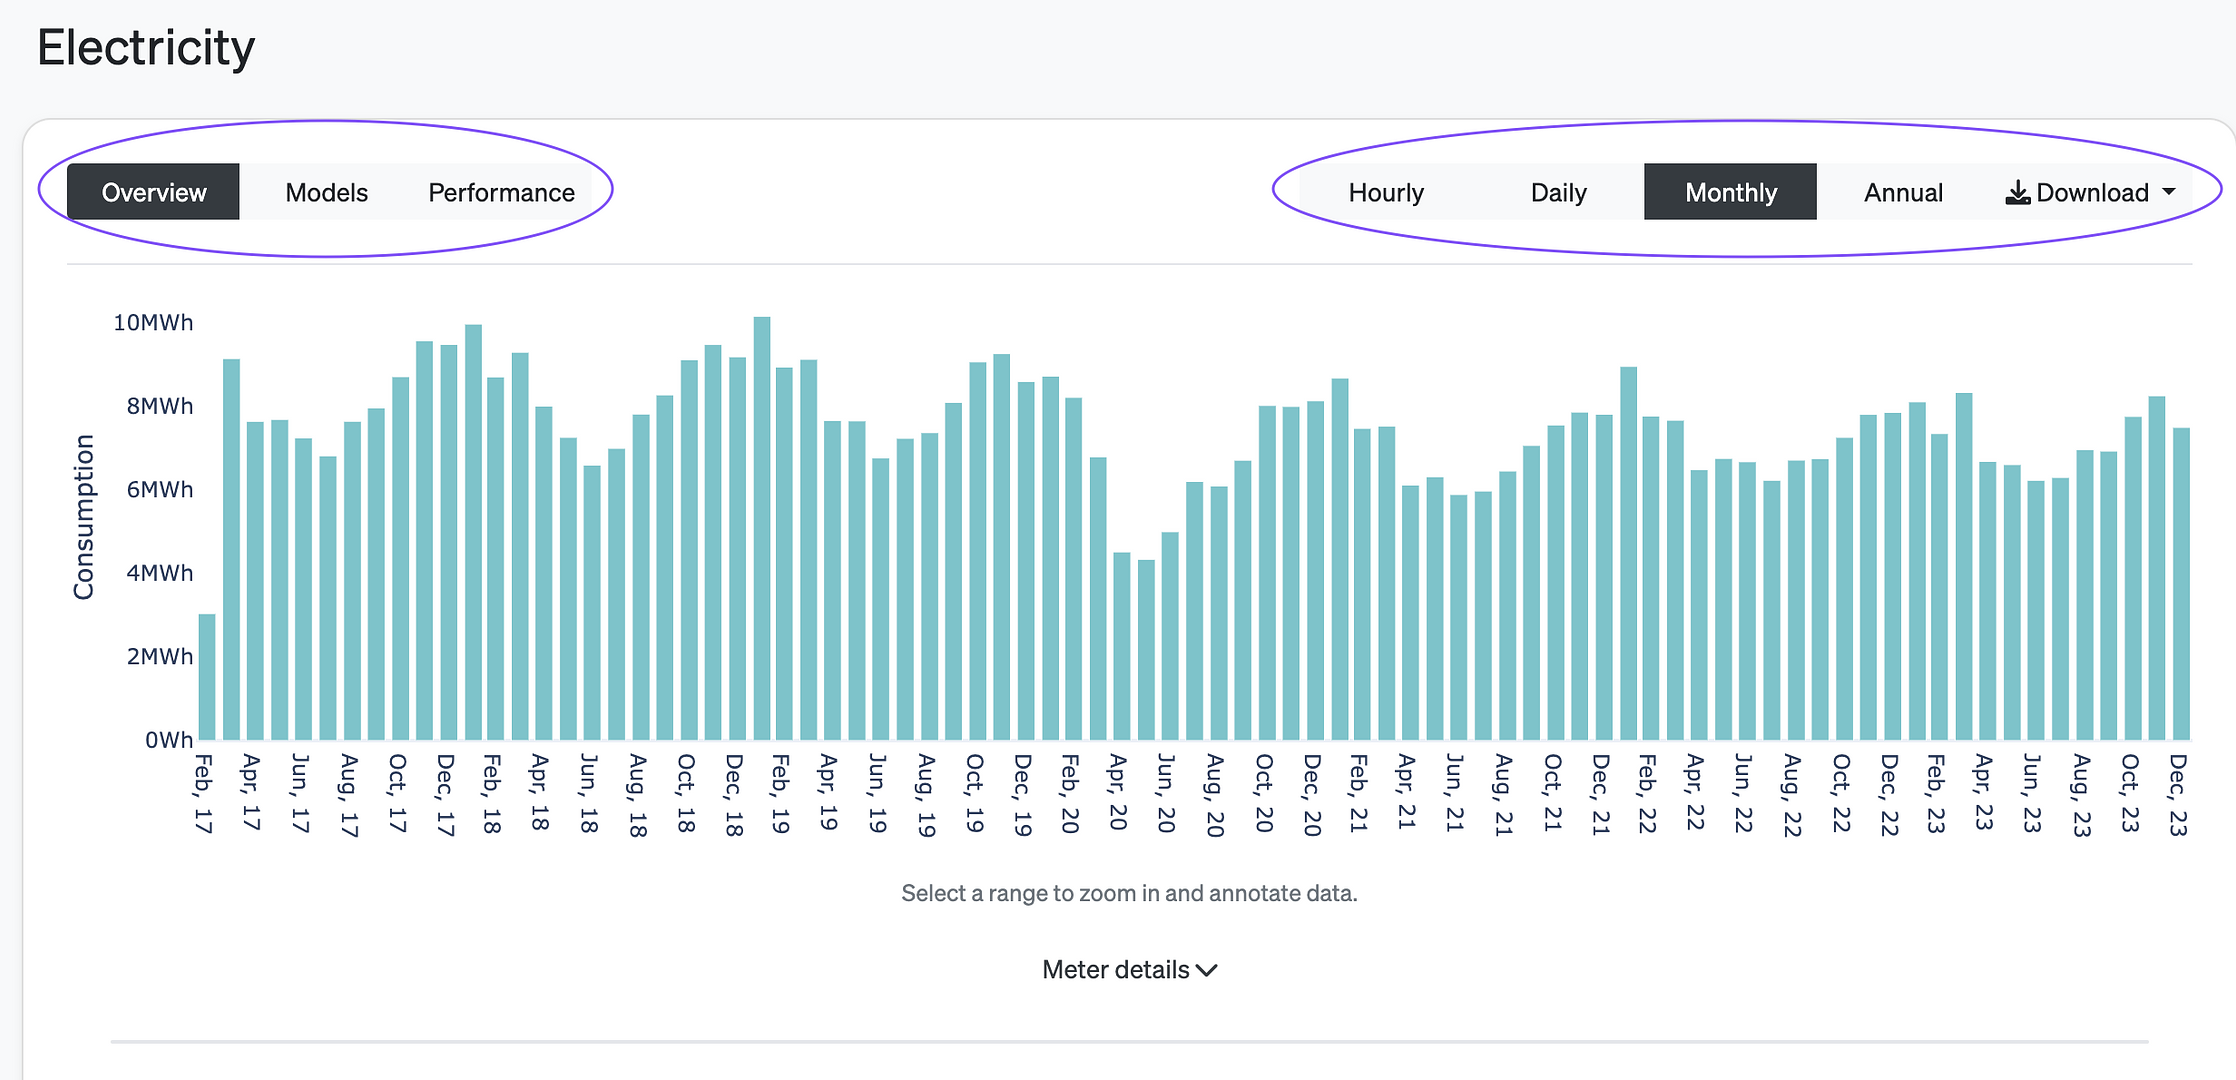
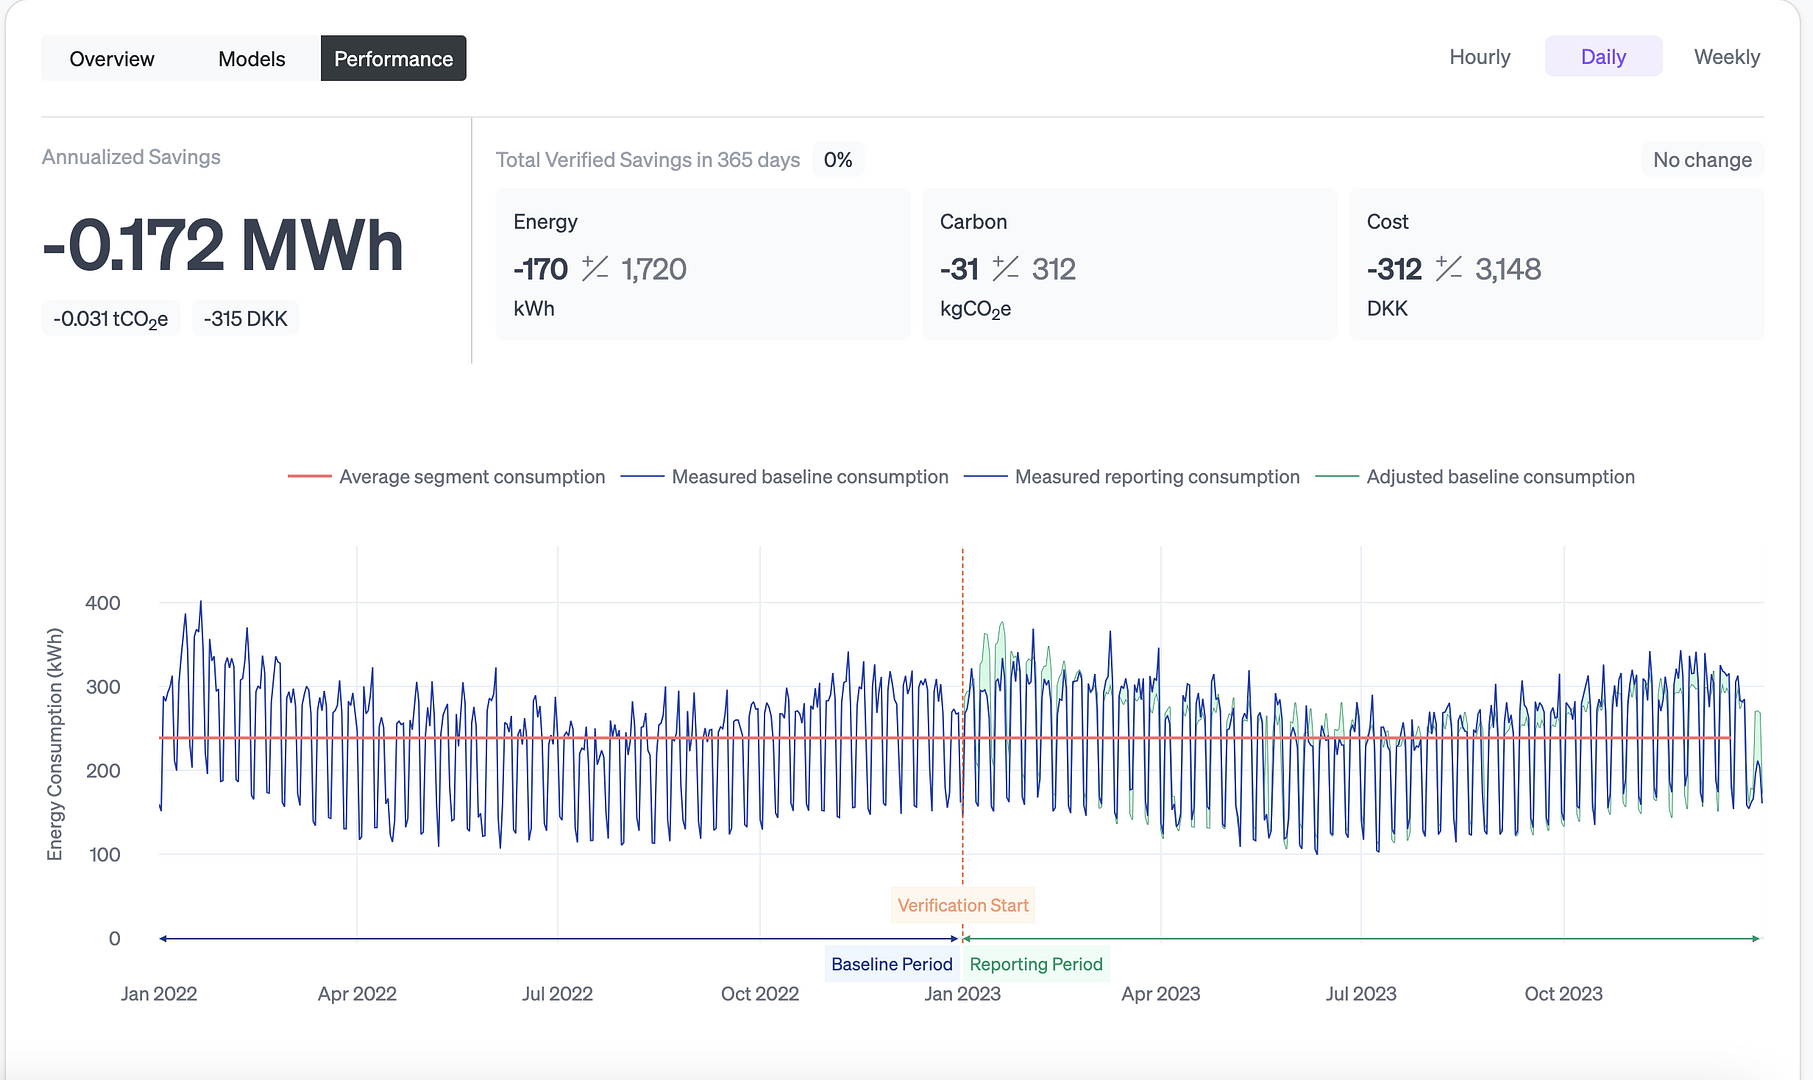
Models gives you more details about the data behind the analytics. You can see which parameters have the biggest impact on your consumption. Under Performance you can see how the building is performing in the current year. This will be updated every year when there is enough data to start the verification. This is calculated on the same principles as verifications and corresponds to a verification for the current year compared to the last year.
Baseload and Peak
Baseload represents the time when your building is running at its lowest level of activity, i.e. idle time. For most buildings, this is when there are no people in the building, or very few people, and outside of normal business hours.
Conversely, Peak is the period when the building is open for business and normally with people present.
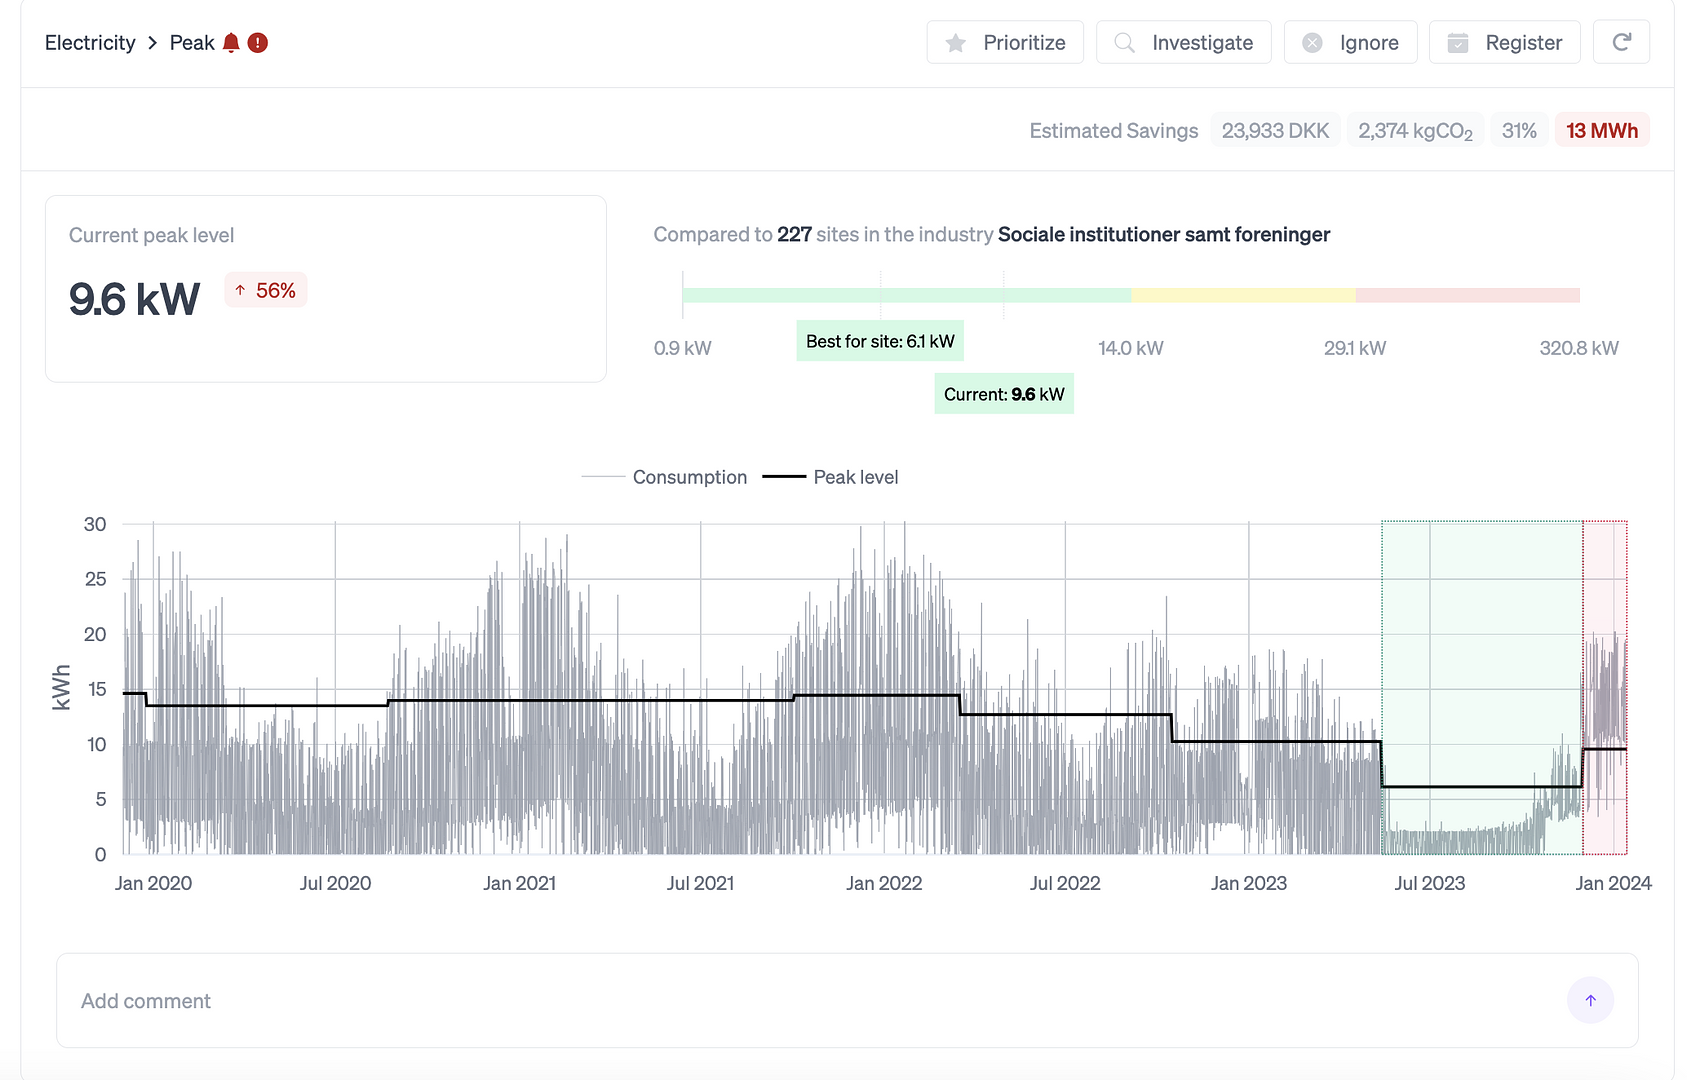
The two charts both show a best for site, which is the time when consumption over a period of time has been the lowest. And if a segment of the graph is red, this represents a worst for site. If your current usage is higher than best for site, this means that the building was previously running with a lower consumption than it is now. Above the graph, you can see the potential savings the digital advisor has identified. You can zoom in to get a more detailed view of a segment by holding your cursor down on the graph and dragging it over the segment you want to see details for.
Above the graph you can see how your building performs, compared to other buildings in the same industry. In this comparison, the size of the building is taken into account. You see your reference consumption, compared with other buildings in the same industry.
Activity
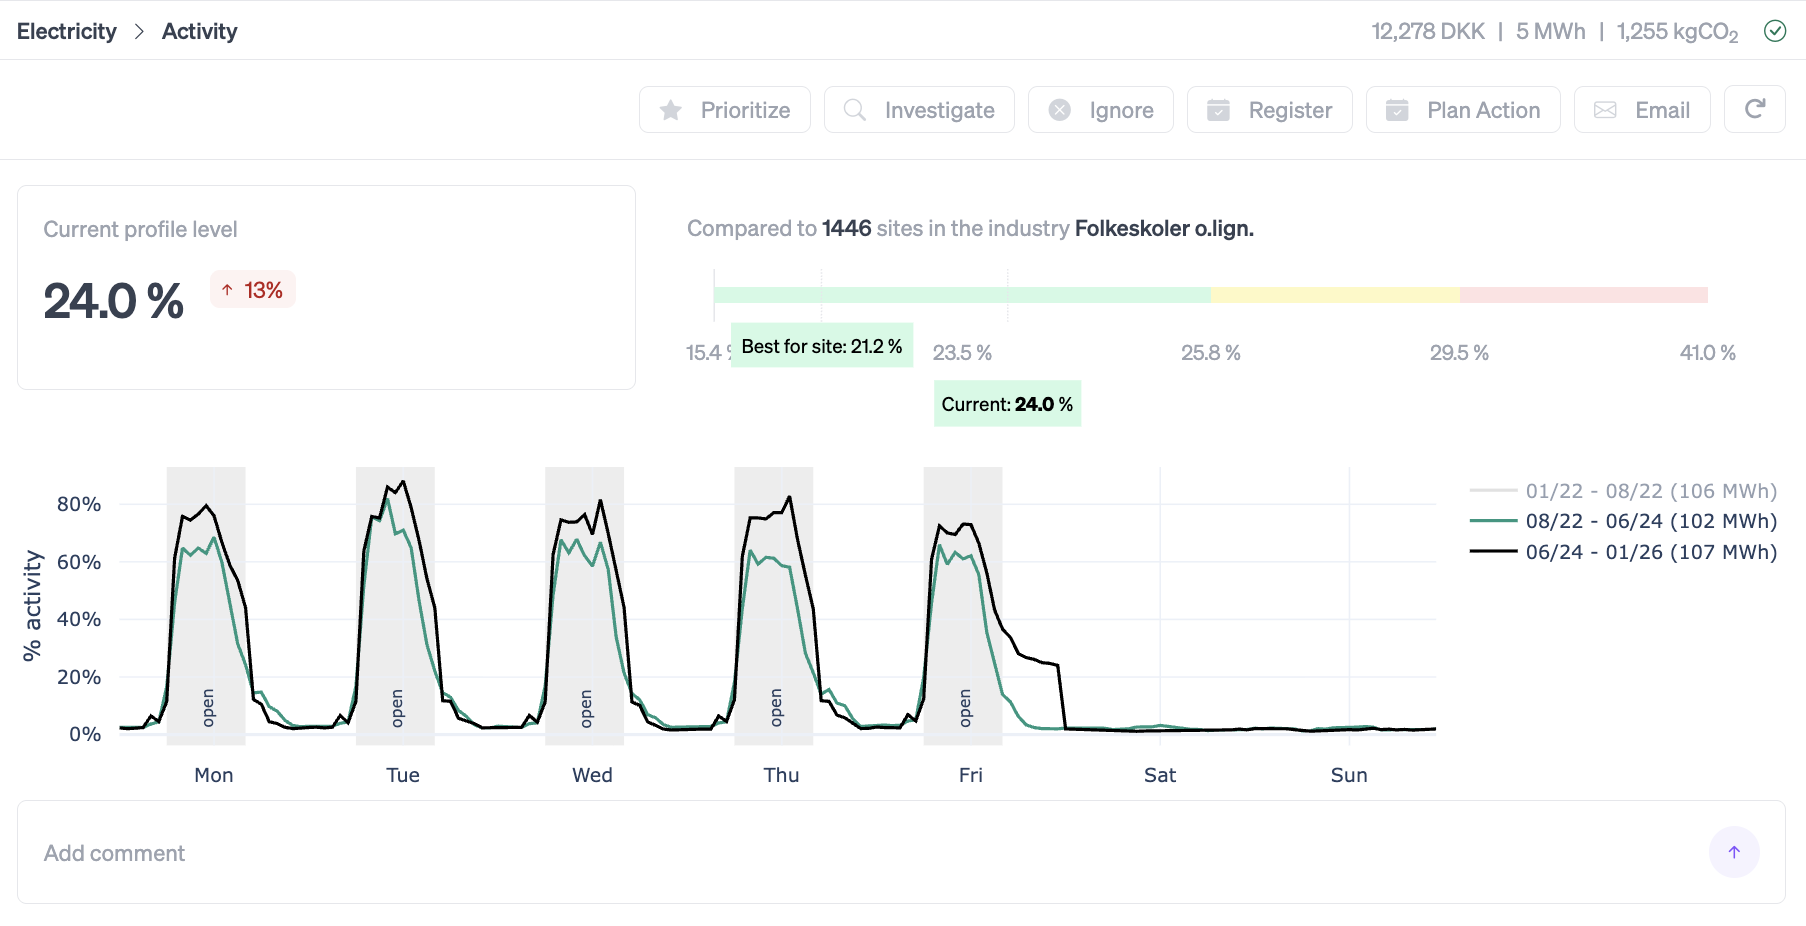
Activity gives you an overview of your weekly usage hour by hour. You can also see your best for site here, and to the right of the table you can see what time period each line represents. Activity can be used to take a closer look at your consumption, understand what percentage of the time there is active energy consumption in the building, and understand the consumption hour by hour. As with Baseload and Peak, you can also compare your activity level with other buildings in the same industry and calculate where you need to be to be among the best buildings.
Activity is often relevant in relation to automatic settings. For example, if energy consumption starts at 2am but people don't arrive until 8am. This can be an indication that some settings are not running as they should.
This way, you can use the analysis to look at individual times and assess whether energy consumption is starting and ending at the right time, or if things are being turned on too early, or off too late. You can also use this analysis to assess whether your best for site may be lower than what was previously recorded. If you want to compare the percentage of activity across your buildings, this data can be found under benchmark.
What does the potential saving represent
"Savings percentage is calculated by comparing the potential savings to the estimated annual consumption.
The estimated annual consumption is derived from the most recent segment, which reflects the building’s current operating conditions. Based on this segment, the system estimates the building’s consumption over a full year. This estimated value is shown for each segment under “Total annual” when you select a segment in the chart.
Depending on the advisor type, the chart and values represent energy consumption, water consumption, or cost."