Your district heating advisor has 6 different analytics that give you an insight into your consumption.
- Penalty
- Consumption
- Summer close
- Heat profile
Each analysis has its own focus point, which helps you understand your consumption and where there is potential to reduce consumption. If Ento has found a potential for optimization, this can be seen above the individual analysis.
All the analyses are based on many data points, and if you want a better overview of these, you can go to models. Here you also get an overview, of which part of your district heating consumption goes to heat and activity. The activity can be for hot water or scheduled heat management. If you go to Performance you can see how the building has performed in the current year.
You can zoom in to get a more detailed view of a segment by holding your cursor down on the graph and dragging it over the segment you want to see details for.
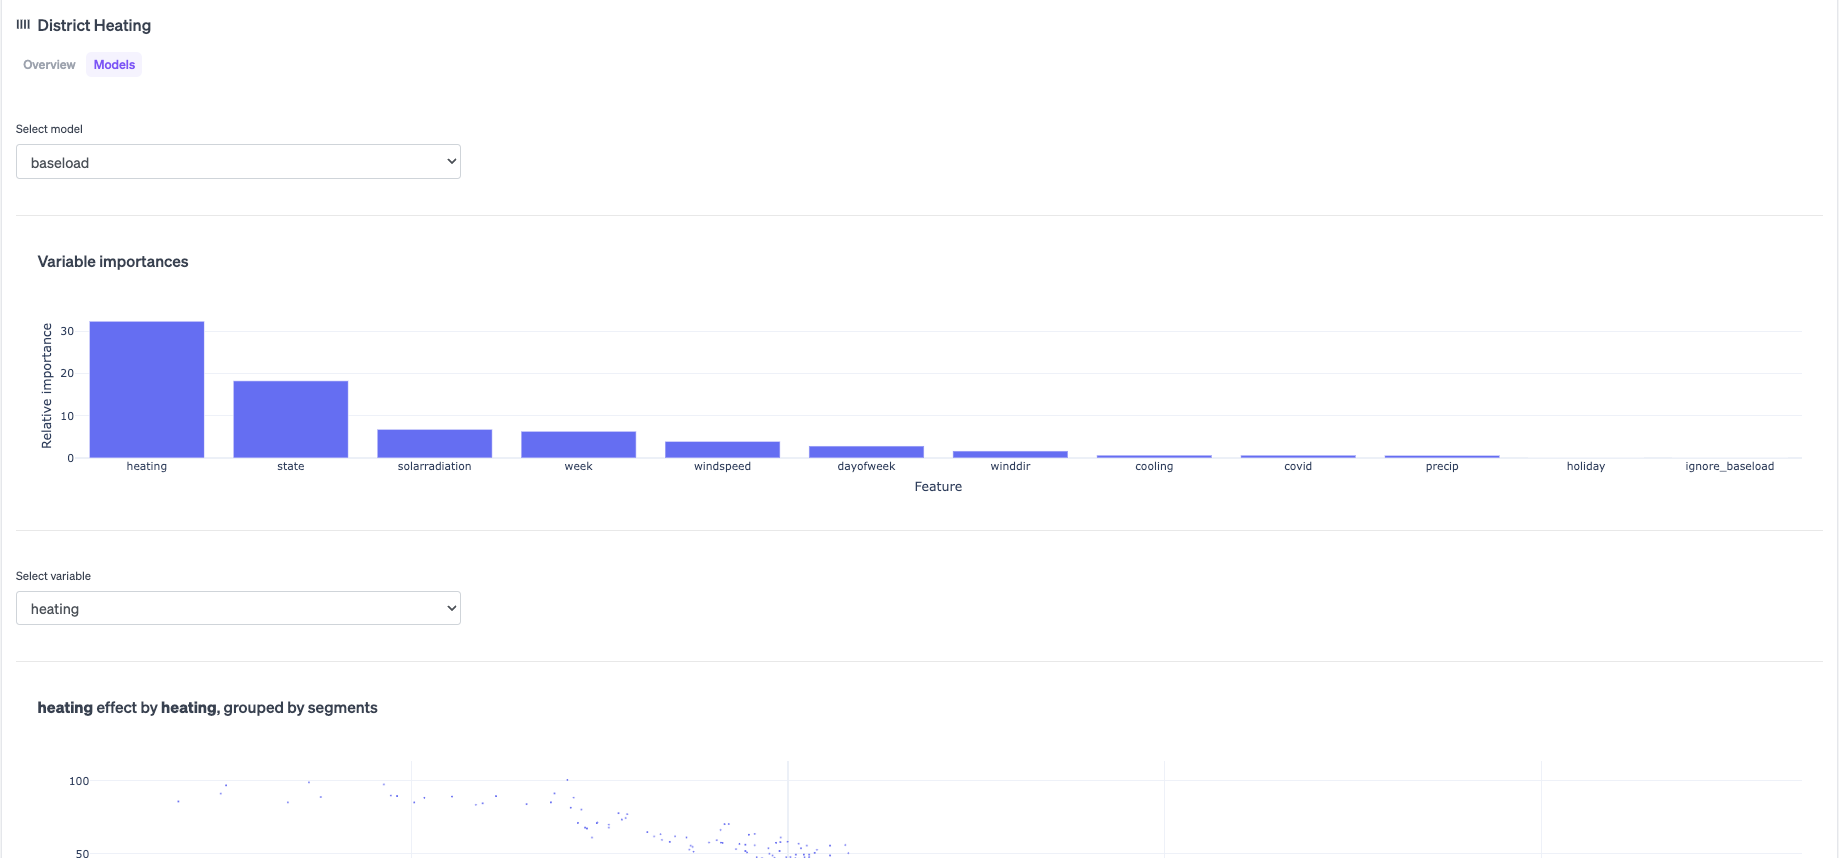
You can also compare the raw consumption data year by year in the consumption overview above compare. This data is not analyzed, but a comparison of the raw consumption data.
Cooling penalty fee (Penalty)
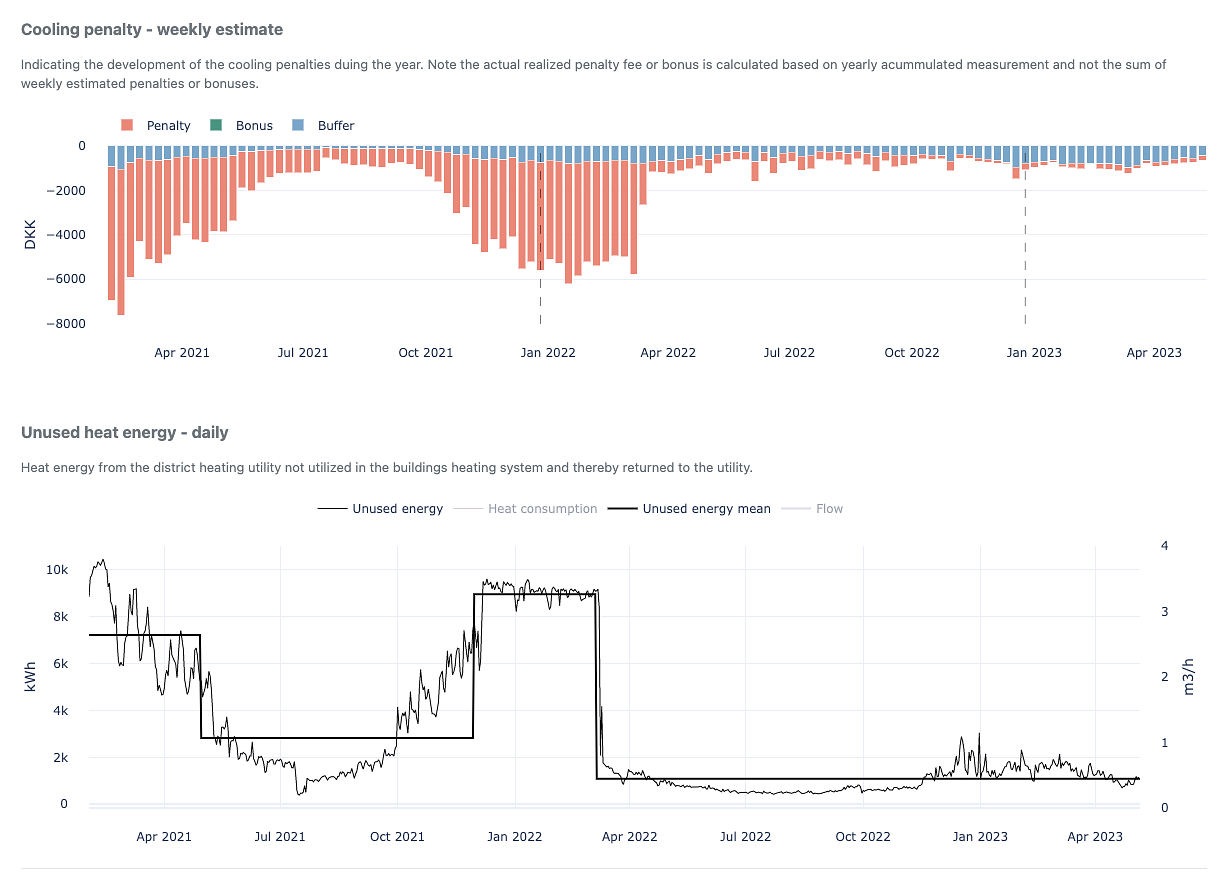
When you send water back to the DH company, there is a penalty fee if the water is too hot. This analysis gives you an overview of whether you are using all the heat you receive from the district heating company or if you are returning the water at too high a temperature.
The analysis gives you an insight into your cooling over the last 12 months and the expected cooling going forward. Using the average temperature, you can see if there are periods where the return temperature has been lower and try to get to that level.
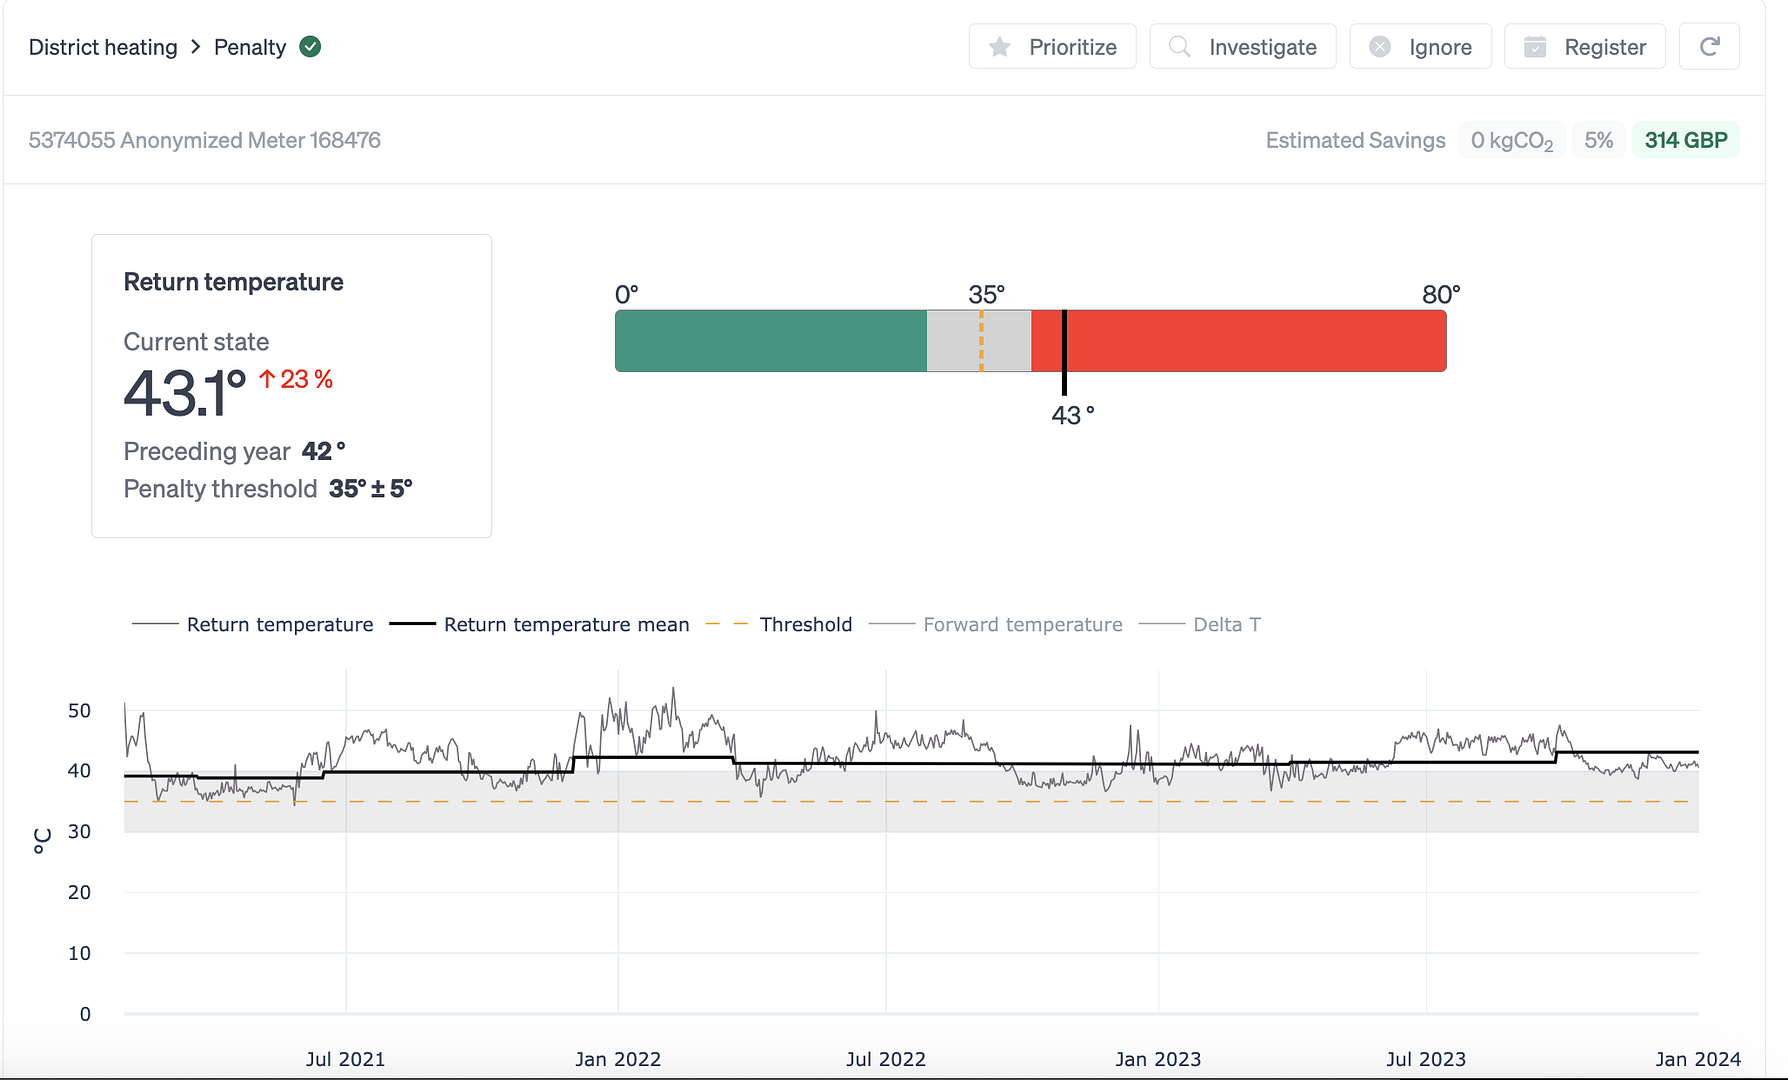
You can also click on Additional Information and get an overview of the cooling penalty week by week and the daily unused energy.
Consumption
The consumption analysis gives you an overview of your heat consumption. Alarms are based on the total consumption for the building and if you want to dive deeper into a potential, you can do so by clicking on the segment you want to compare with.
Here you can compare the current period against the segment you have selected. You then get an Activity and a Baseload analysis. The activity analysis allows you to see when in the day the building is consuming compared to the selected segment. The baseload analysis gives you an overview of the baseload consumption during the selected period. Both analyses are subject to weather and calendar conditions.
Summer close
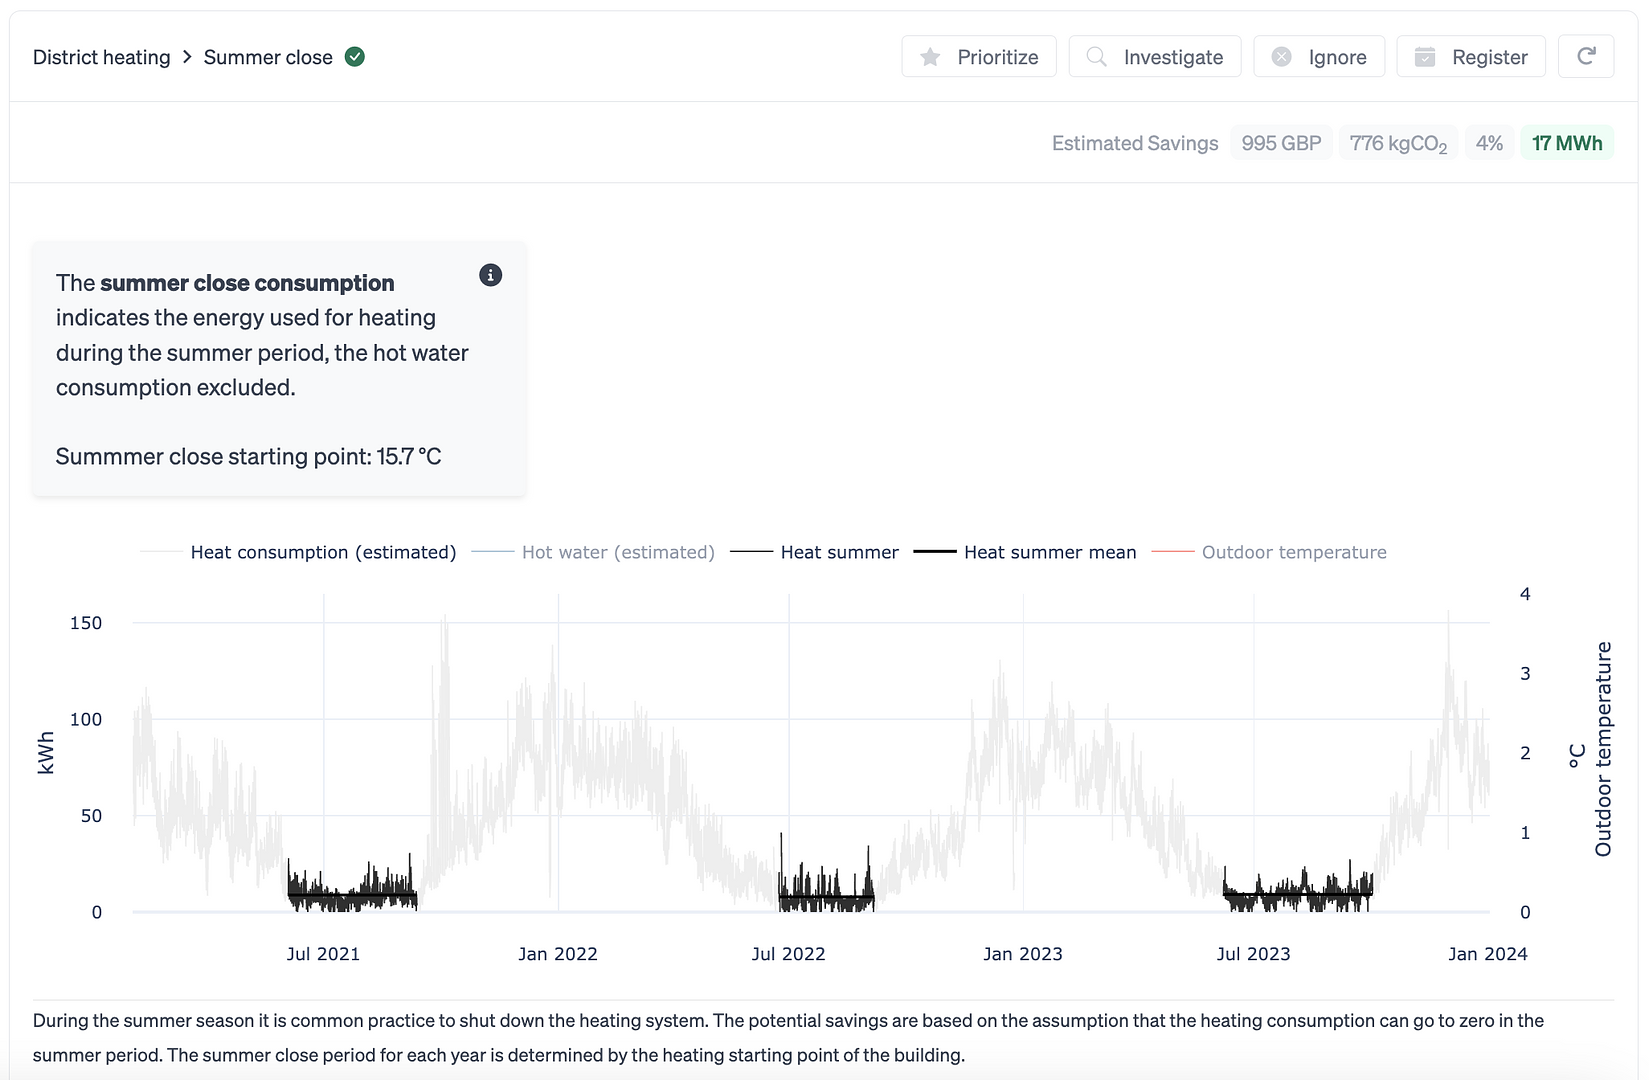
This analysis gives you an overview of the heat consumption during the summer period. The potential for savings is calculated based on the assumption that the building's heating can be turned off during this period and there should be no consumption.
Of course, this will vary slightly based on the function of each building, but the analysis will tell you if you are using unnecessary heat during this period.
Heat Profile (Heat Profile)
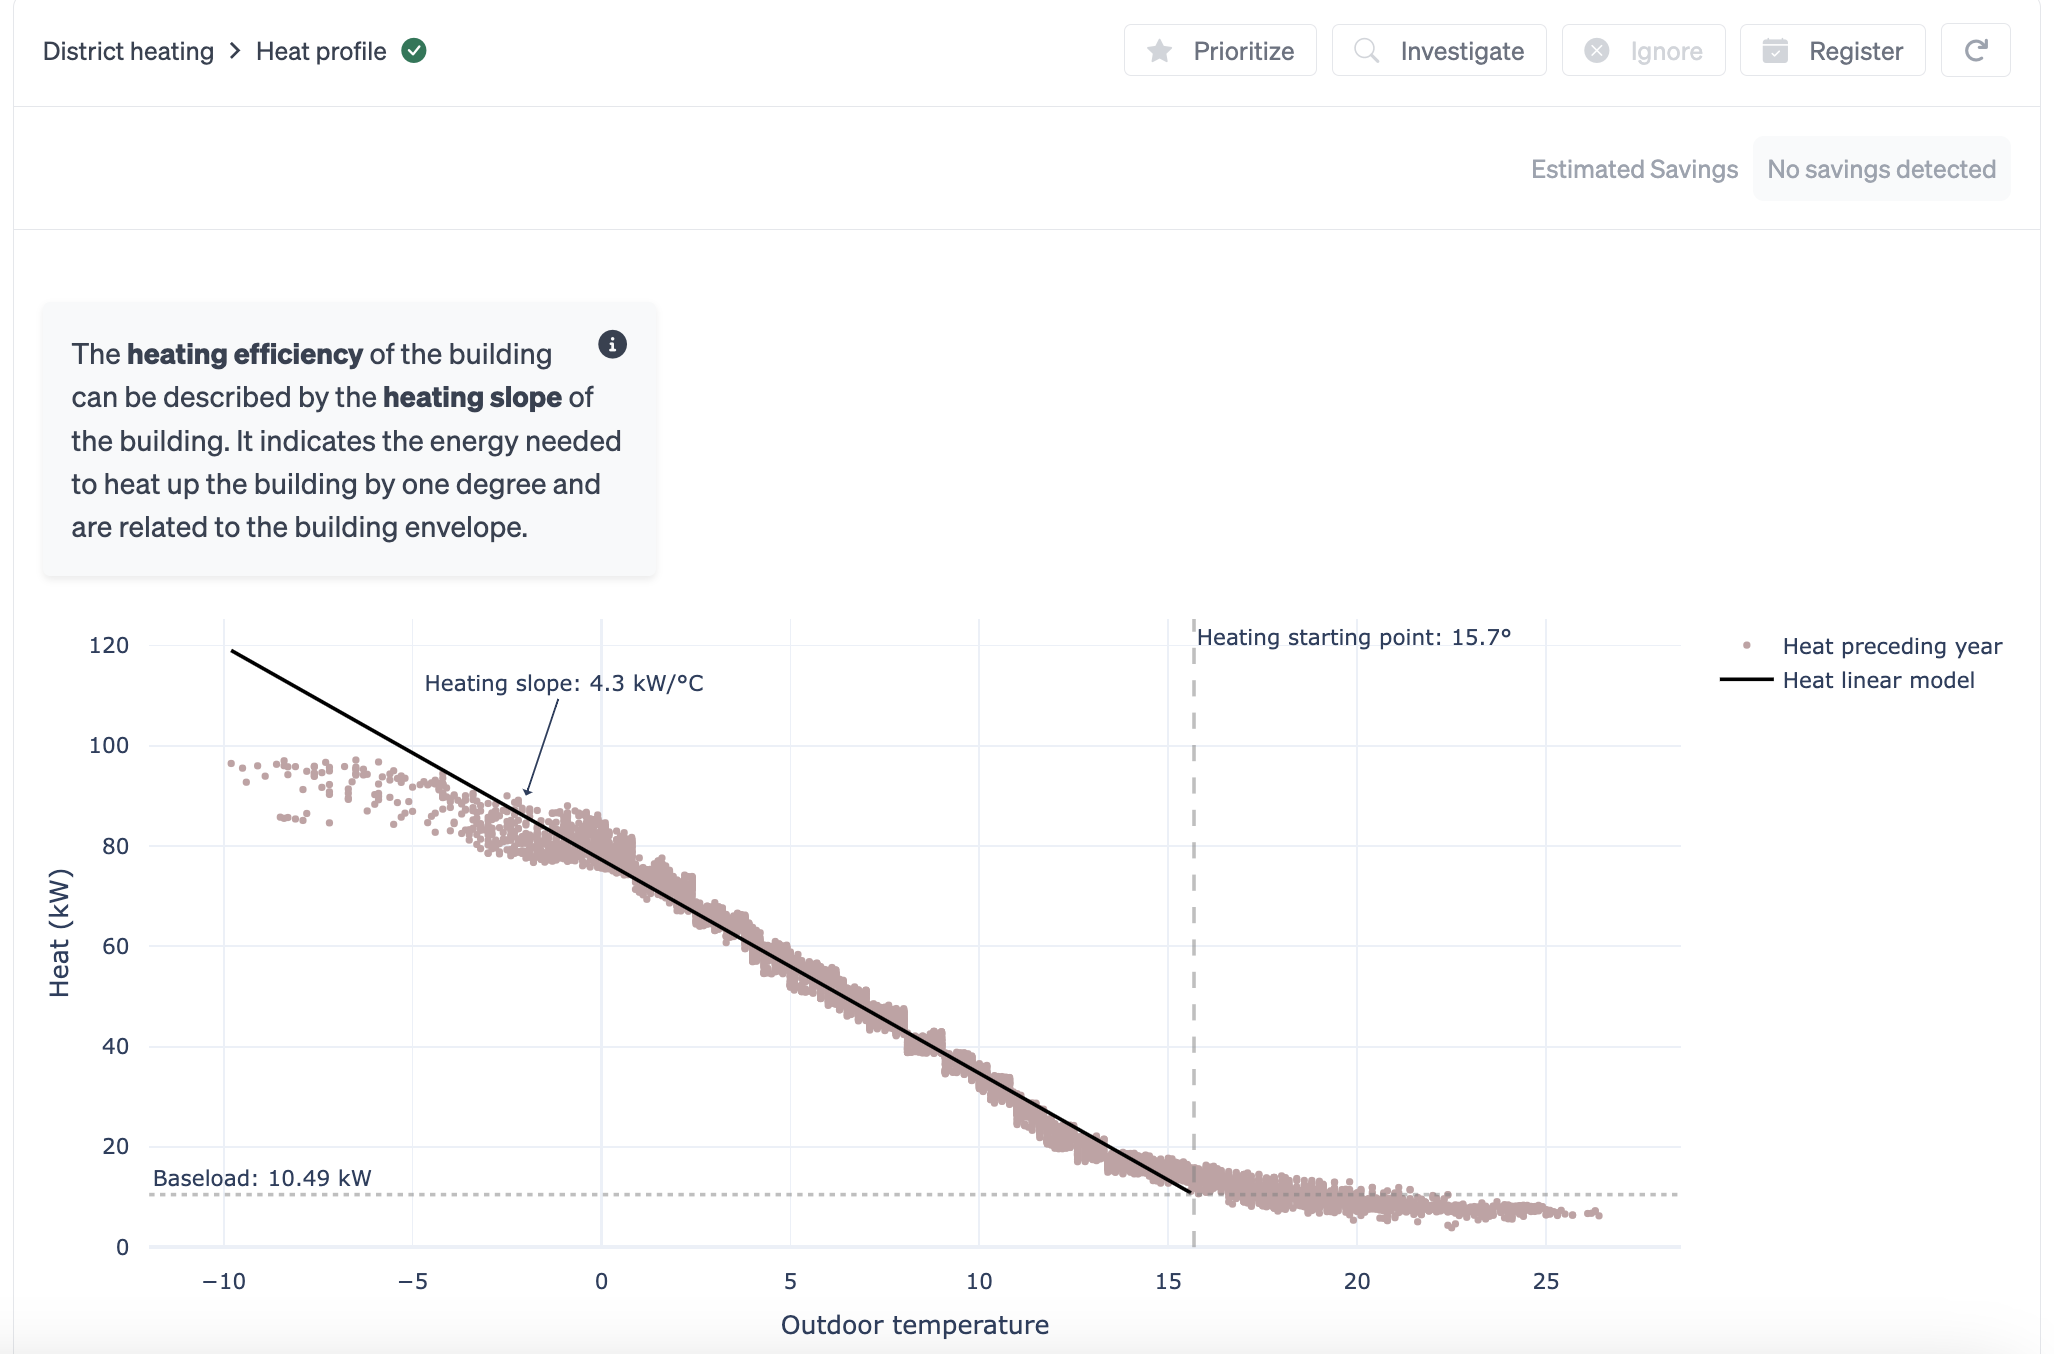
Your heating profile is an analysis of your heat consumption and how it relates to the outdoor temperature. Your heating slope indicates how much energy is used to heat the building degree by degree and relates to the building's climate screen.
The temperature marked as heating starting point is Ento's recommendation for when you should start heating. Please note that it does not represent the starting date, but the starting temperature.
Heat profile is also interesting to compare across buildings in the benchmark function.
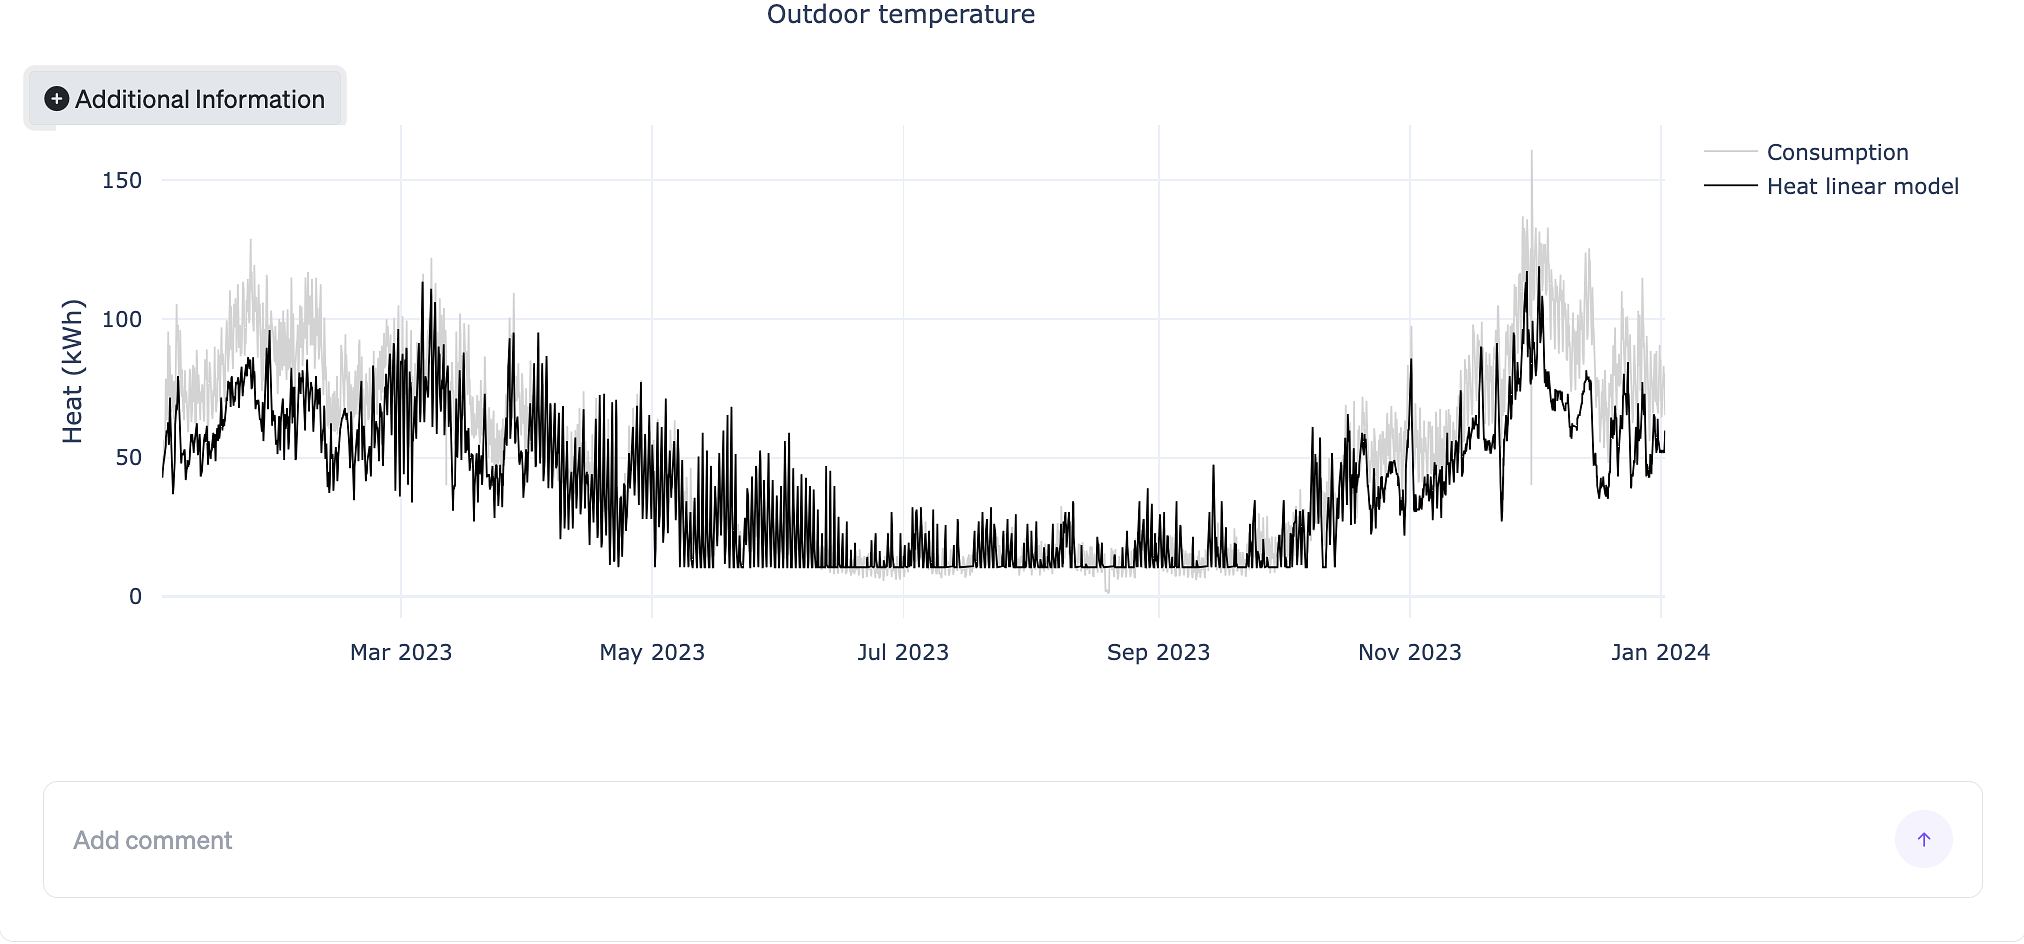
Click on Additional information to get an overview of the past year's consumption (gray) compared to what the consumption would look like if it follows the linear heating slope (black).
What does the savings percentage represent
Savings percentage is calculated by comparing the potential savings to the estimated annual consumption.
The estimated annual consumption is derived from the most recent segment, which reflects the building’s current operating conditions. Based on this segment, the system estimates the building’s consumption over a full year. This estimated value is shown for each segment under “Total annual” when you select a segment in the chart.
Depending on the advisor type, the chart and values represent energy consumption, water consumption, or cost.