Savings is where you see the different activities that have been registered and the effect of these. Savings are always related to an action in a building.
Verifications don't have to be linked to a specific activity or only to a single building. With verifications, you can create verifications across buildings and choose the baseline period you want to verify with.
Savings
When you go to savings, you get an overview of the different activities you have registered and details about the project.
First, you get an overview of the recorded annualized savings and the total annual savings.
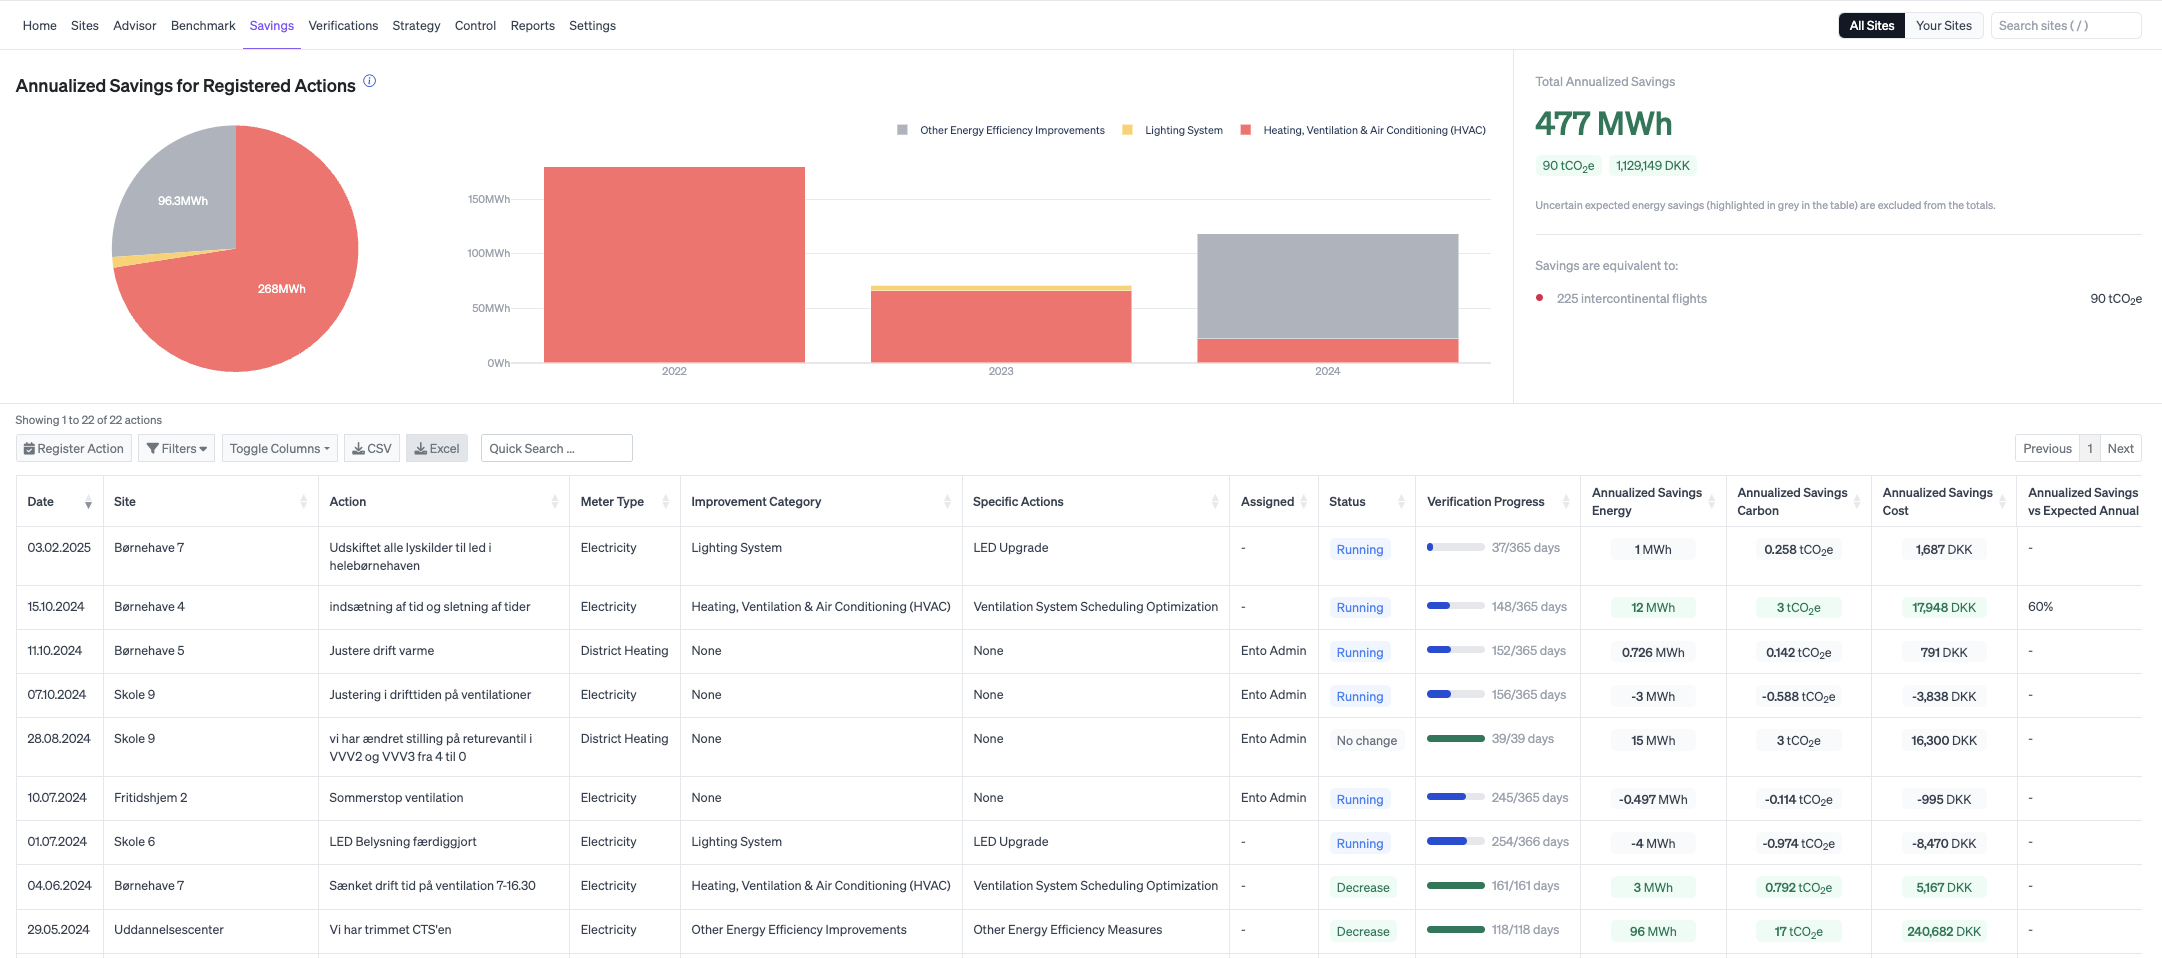
You can then see the activities that have been registered, the results of these and how far along they are in the verification process.
Click on the individual action to get a more detailed overview of the action and its result. If the verification is still in progress, you can see the verified savings and the expected annual savings.

In the graph, you can see the baseline period on which the calculation is based, as well as the result since the implemented action.
Below the graph you get more details on the action taken. E.g. adjusted baseline consumption, return on investment etc. Some of the information here is added by you, and you can update the activity by clicking Edit details.
If you go to Model Analysis you will get more details about the data behind the analysis.

You can register a new activity directly on the savings page, but you can also do it within the specific building. Read more about how to register an activity here.

Verifications
Verifications give you an overview of energy savings that are not based on a specific action. A verification can be for a single building, a single meter in that building or a group of buildings, sorted by industry and/or tags. You register verifications yourself and can create as many as you want.
You can create verifications based on a single building, industry or tags.
Once you’ve made a verification, the analysis will run and the result will be ready within a short time.

In the verification overview you get an overview of the verifications you have made and you can click on the individual verification for more details.
Here you get the same details as you do on registered activities. You get the verified savings and the expected annual savings and you can edit the verifications by clicking Edit details.

If you have created a cross-building verification, you also get a portfolio analysis of which buildings are included and excluded in this verification. You can see how each building included in the verification has performed, how much energy each building has saved (or not saved) and the percentage change.
A building is excluded from the verification, if there is not the right data basis, to include it.
Click on any of the buildings in the lists to see the individual verification for that specific building.


To learn more about how to create a verification, read more here.
Applies to both savings and verification
Both the calculations for savings and verifications are performed with 95% certainty. Therefore, there will always be a small uncertainty as the savings are calculated based on the expected consumption if no changes had been made. This is also the reason why the column with recorded savings has a +- margin.
How Ento verifies your savings and actions - the underlying IPMVP stands for "International Performance Measurement and Verification Protocol", which is an international standard for measuring and verifying energy savings.
IPMVP provides greater credibility and transparency of energy optimization projects, which provides a better basis for decision makers and a more efficient allocation of resources for future optimization projects.
IPMVP uses a number of specific methods and procedures. First, a baseline period is established. This is the period where the normal energy consumption and data is analyzed before the optimization was implemented. The baseline period represents a normal operating environment without any changes. By default, a "smart" baseline period is defined, but you can manually change and set the baseline period before or after recording an action or verification. This baseline period is the reference point against which energy savings are measured during the reporting period.
The reporting period is the time after the optimization was implemented. By default, the period is one year, but this can be manually changed or if it is a verification of an activity, the reporting period will end if a new segment is created within one year. It is during the reporting period that energy consumption is monitored and the impact of the optimization is evaluated compared to the baseline period. The adjusted baseline consumption is calculated, i.e. the amount of energy the building would have used if the optimization had not been implemented. By comparing the adjusted baseline consumption with the actual measured energy consumption during the reporting period, the savings are calculated.
If you go to savings or verifications on the platform, you'll get detailed information, including an overview of specific periods.