When you go to savings, you get an overview of the different activities you have registered and details about the project.
The chart presents an overview of the annualized savings by category and year, while on the top right you have an overview of the total annualized savings achieved across all your implemented projects.
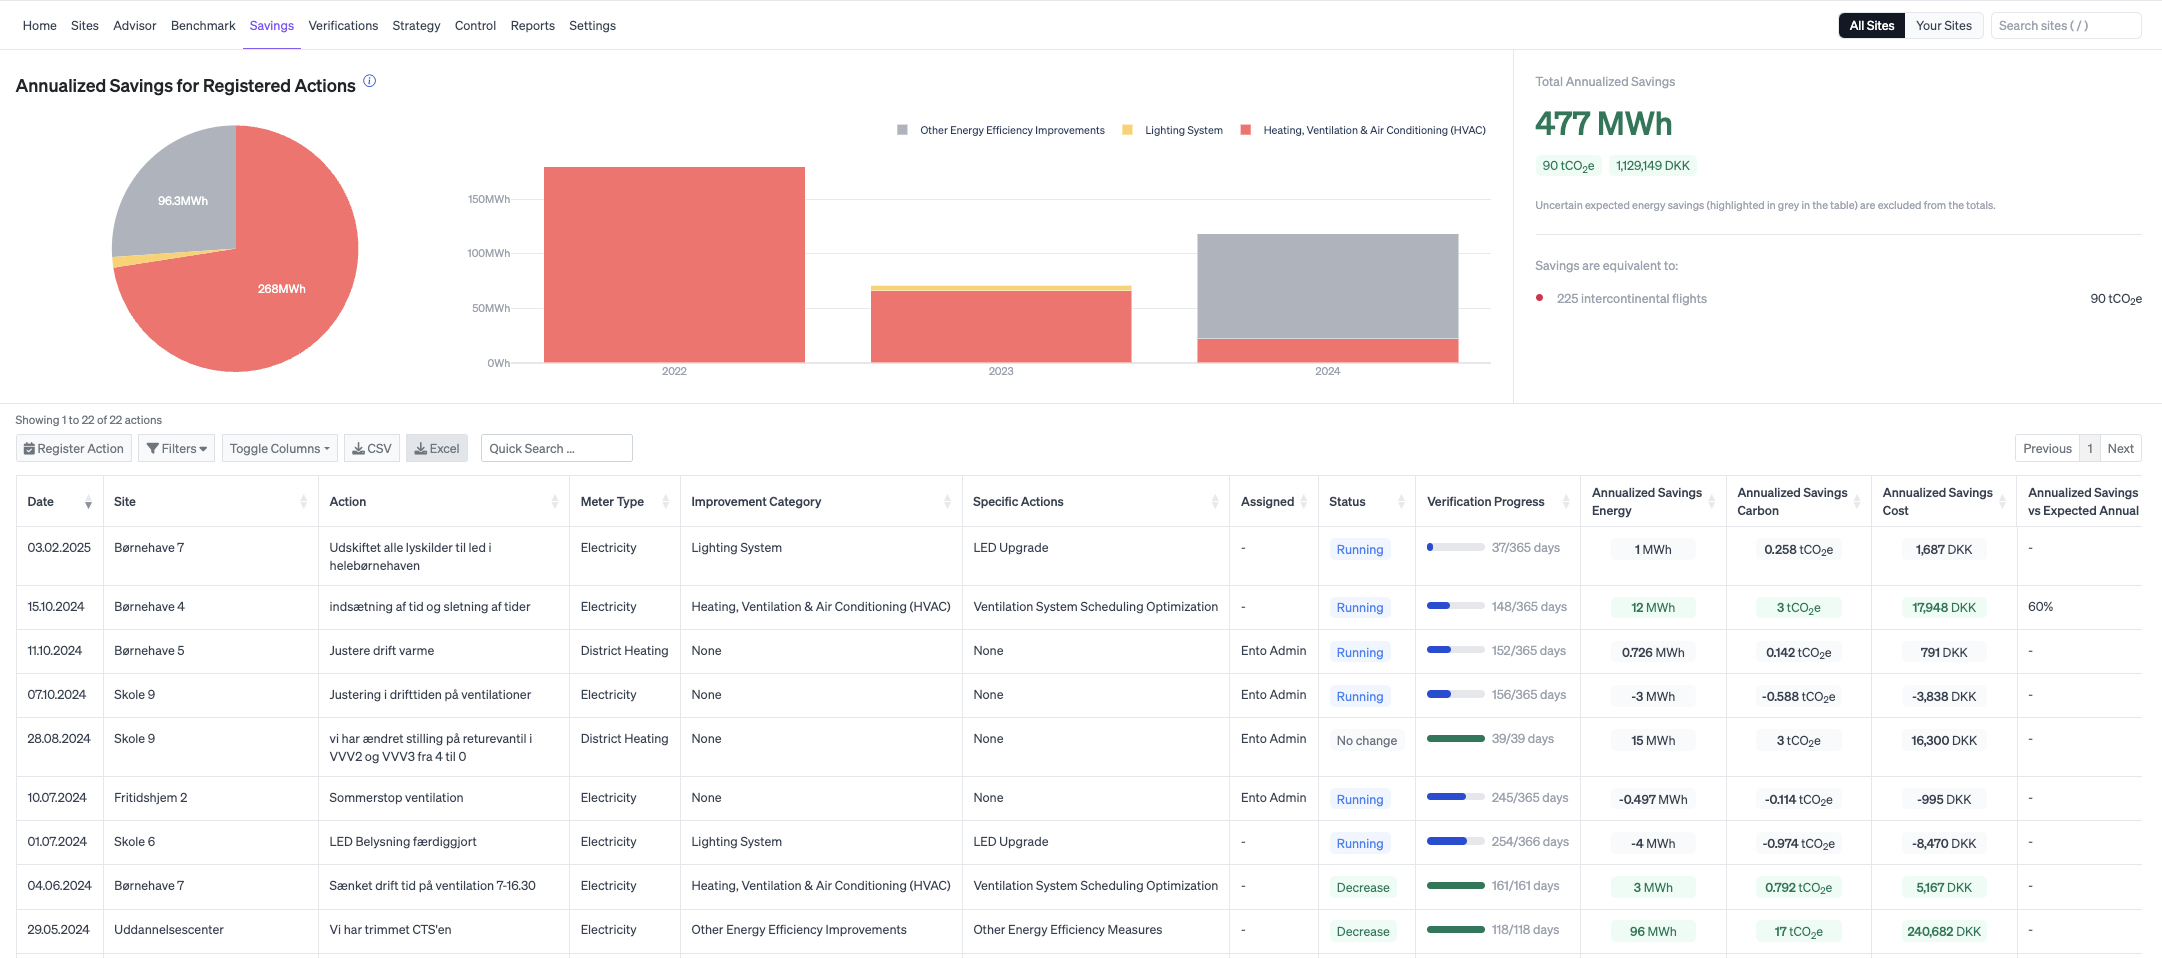
You can then see the activities that have been registered, the results of these and how far along they are in the verification process.
The individual actions
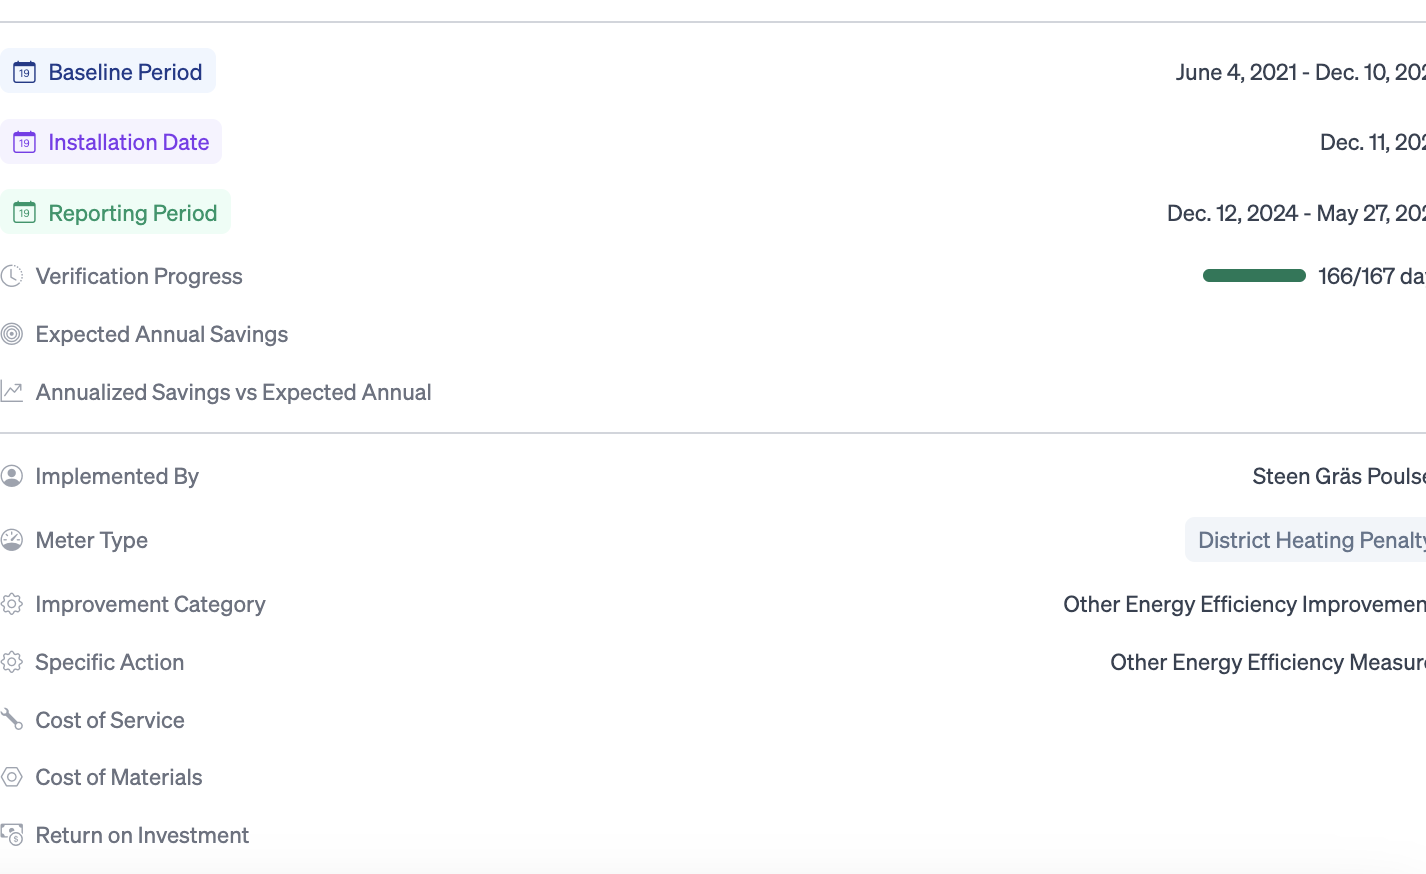
Click on the individual action to get a more detailed overview of the action and its result. If the verification is still in progress, you can see the verified savings and the expected annual savings.

In the graph, you can see the baseline period on which the calculation is based, as well as the result since the implemented action.
Specified performance metrics
Below the graph you can get more detailed information and transparence about the verification and the result and more control over model configuration.
Within each verification, under Model analysis, we now show additional performance metrics that help you evaluate how well the baseline model fits your data.
These metrics make it easier to assess model accuracy and understand the uncertainty behind the savings results.
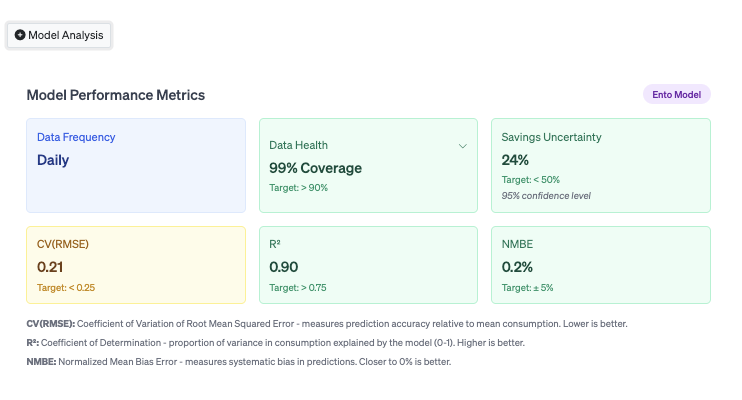
Model Performance metrics
The model performance metrics, gives you an overview of the metrics used in the verification on how they each perform, plus the target level set by M&V protocols such as IPMVP and ASHRAE Guideline 14.
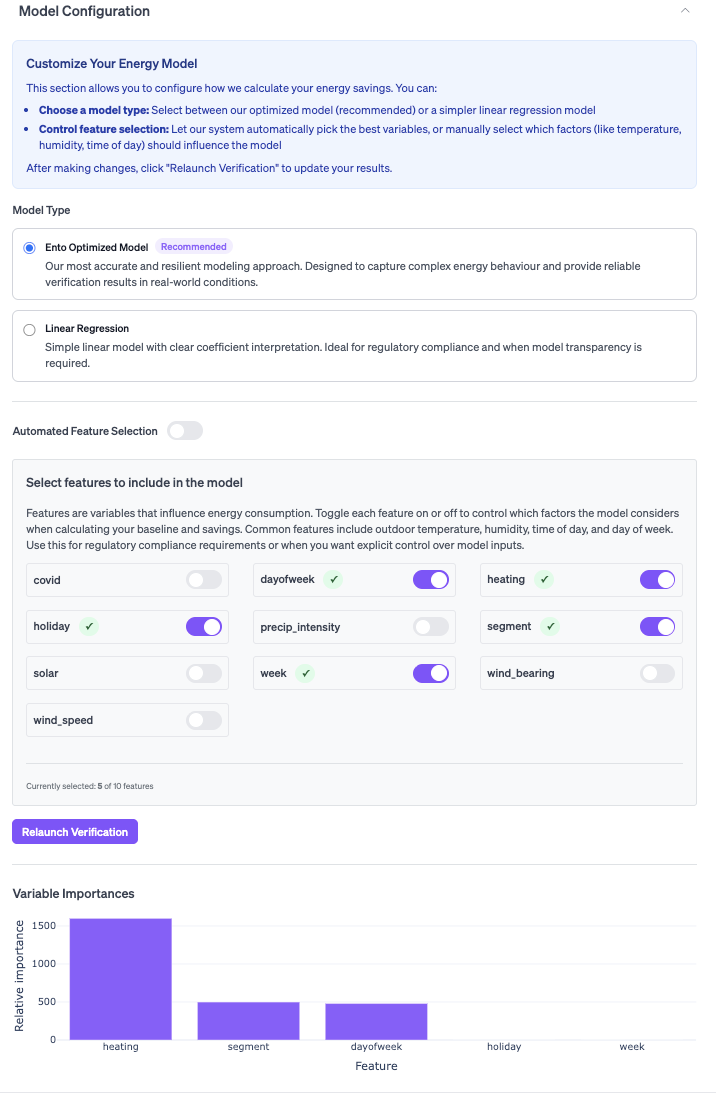
Model Configuration
In the Model Configuration section you can:
- Switch between Ento’s optimized baseline model and a simple linear regression
- Manually select which variables are included in the model
This gives you flexibility when experimenting with different modeling assumptions or when a simpler model is preferred for transparency or comparison.
Beside choosing the model type, you may also manually choose which features the verification should be based on. Beneath the features to choose between, you get an overview of the variables that currently affect this verification.


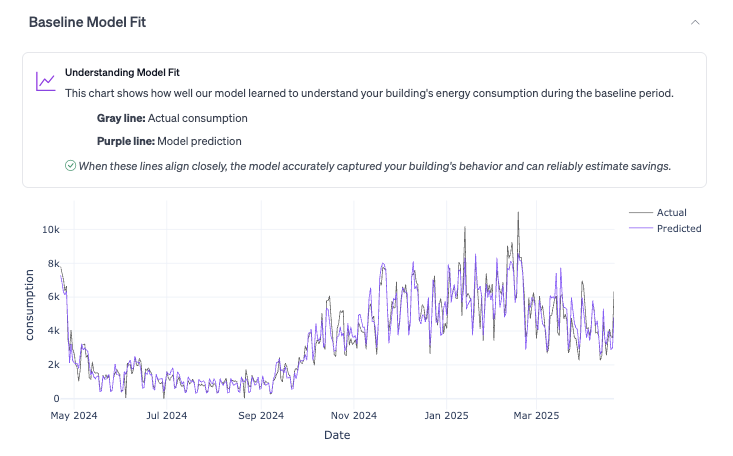
Baseline Model Fit
In the Baseline model fit section, there is a clearer visualization of model predictions versus actual consumption during the baseline period.
This helps you quickly assess whether the model is correctly capturing the building’s operational and seasonal dynamics before relying on the savings results.
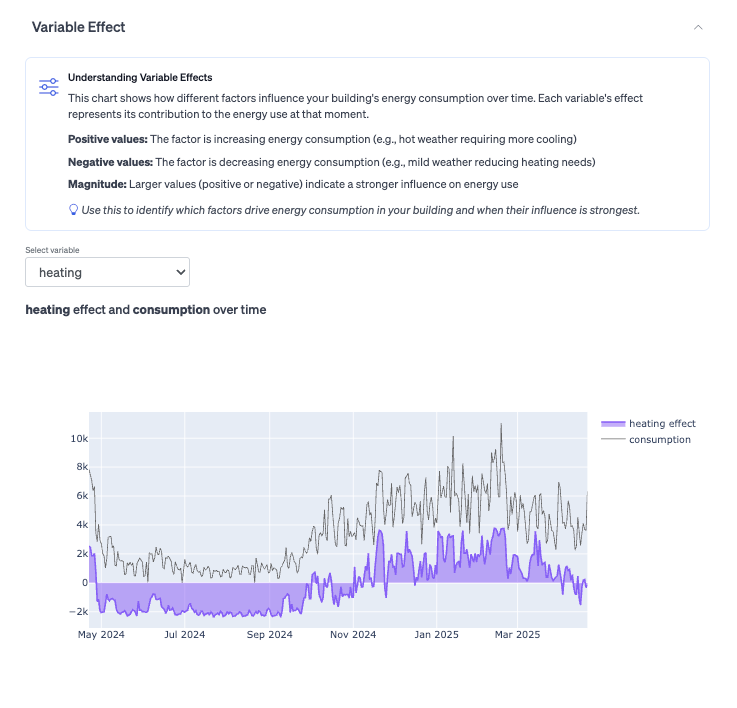
Variable Effect
The variable effect, helps you dive deeper into the data behind the verification. You can use this to see how different variables affect the consumption in the building.
General information
Below the graph and the Model Analysis, you get more details on the action taken. E.g. adjusted baseline consumption, return on investment etc. Some of the information here is added by you, and you can update the activity by clicking Edit details.
You can register a new activity directly on the savings page, but you can also do it within the specific building. Read more about how to register an activity here.
About savings estimates
Energy savings cannot be directly measured; they are estimated by comparing actual energy consumption to a modeled baseline representing what consumption would have been without the project.
Ento applies industry-standard M&V methodologies to produce the most accurate estimate possible and provides transparency metrics (model performance, uncertainty, data coverage) to support interpretation of the results.
All savings estimates should be reviewed by a qualified professional before being used in contracts, compliance filings, or official reporting.