With sensor analysis of your indoor climate, the digital advisor helps you monitor and find potential savings. The analysis is based on KL's standards for indoor climate.
The analysis focuses on the atmospheric indoor climate, i.e. air quality (ventilation) and the thermal indoor climate, i.e. temperature.
Atmospheric and thermal indoor climate
Focusing on air quality and temperature, you get alarms if the level reaches level 5. The indoor climate alarms do not provide potential savings in DKK/euros, but rather focus on user comfort. As with the other analyses and alarms, an alarm does not occur because the recommended level exceeds the limits once. The alarms occur if there is an average comfort score of over 5 during the past week. However, not for the entire day, but only within the building's hours of use. The alarms occur on individual sensors, and when you log in to Ento you get an overview of which sensors are in the critical zone.
In addition to the alarms, the graph and accompanying table also give you an overview of how the building is performing. Which rooms are at a good stable level and where there is a higher level that is moving towards critical and alarm level.

If you click on the individual sensor, you get more details about both temperature and CO2 levels. For example, you can see when the area is above critical levels and how buildings perform compared to the reference.

Focus on night and weekend lowering
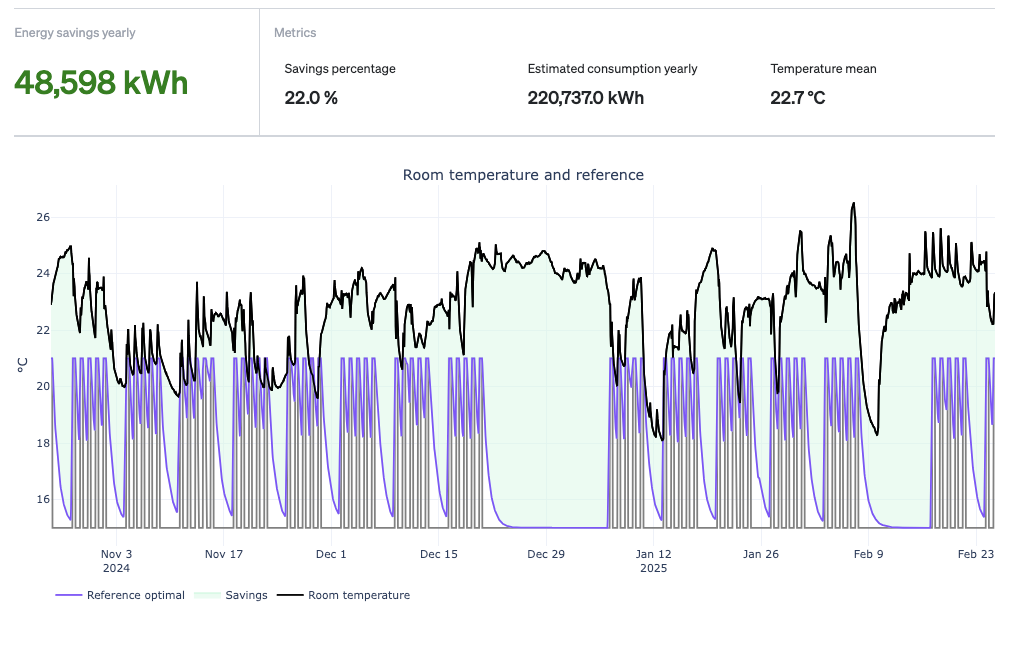
In addition to your comfort analysis, you also get a concrete Temperature Setback analysis. Like other analyses in Ento, this analysis focuses on savings in CO2 and DKK/euros. The analysis is based on heat data from your sensors and the potential is calculated based on whether you have the right "temperature setback", i.e. whether you lower the temperature at the optimal time to achieve the desired temperature during opening hours.

As a starting point, the reference temperature is set to 21 degrees, unless we receive data from Leanheat, where the reference temperature follows the set references.
If you want to get more details about an individual sensor and how the temperature is on different days of the week, you can click on the sensor in the overview. You can then see on a graph how the temperature is compared to the reference and to the building's active hours.
This graph can help you understand the pattern in the applicable area of the building and optimize operations accordingly.