The EPC (Energy Performance Certificates) module in Ento gives you a complete picture of your portfolio's energy labels — from a high-level overview of all certificates, to building-by-building planning for improving ratings. This guide walks you through every view and explains how to get the most out of each one.
What Is the EPC Module?
The EPC module in Ento lets you:
- See all official and metered EPC ratings across your entire portfolio in one place
- Compare official ratings against actual (metered) energy performance
- Identify which buildings most need improvement
- Plan and prioritise EPC improvement projects, with real-time cost and savings estimates
- Track planned, implemented, and proposed improvement actions at each site
The EPC overview
Summary KPIs
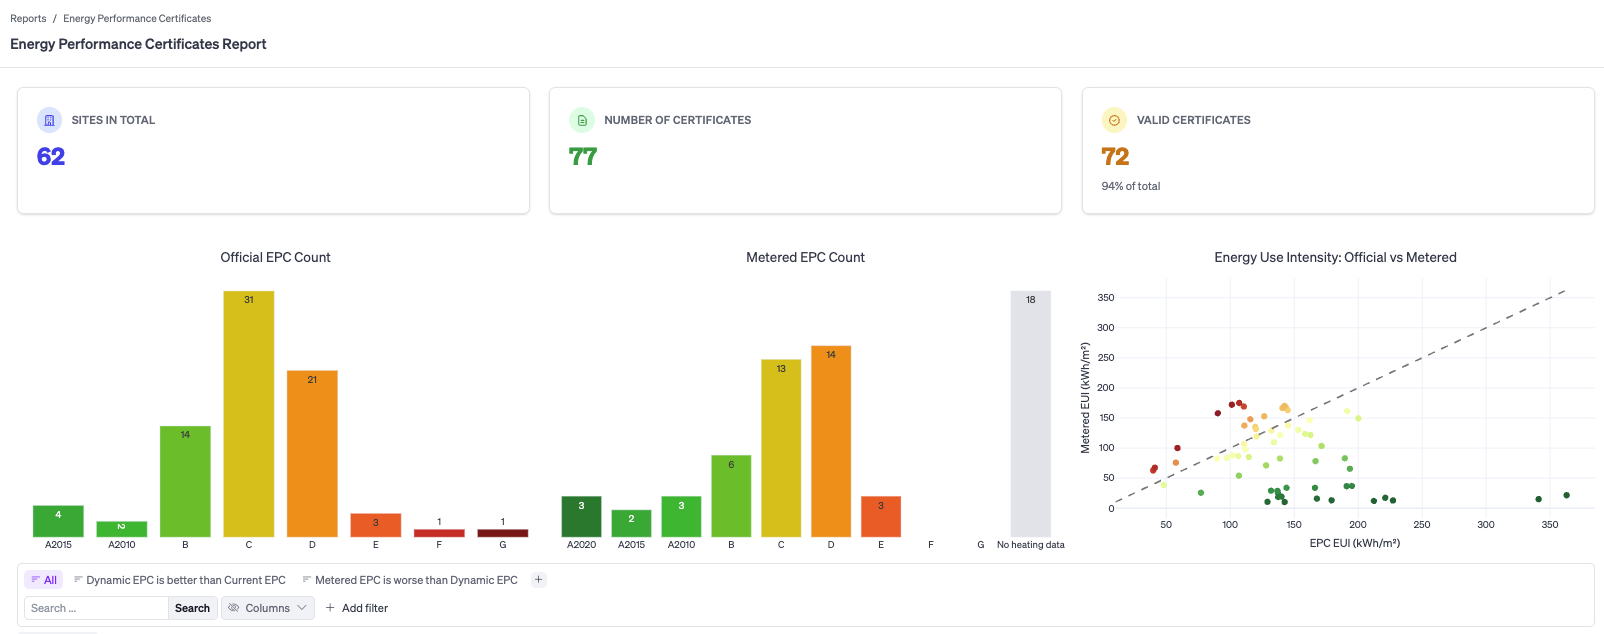
At the top of the report you'll see three summary cards:
- Sites in Total — the number of sites in your portfolio with at least one EPC
- Number of Certificates — the total count of certificates (a site may have multiple)
- Valid Certificates — the number of currently valid certificates, shown with a percentage of the total
These numbers update automatically as you apply filters.
Charts
Three charts sit below the KPIs, giving you a visual breakdown of your portfolio's energy performance:
Official EPC Count A colour-coded bar chart showing how many buildings hold each official EPC rating (A2010 through G). Hovering over a bar shows the exact count and label.
Metered EPC Count A similar bar chart, but based on each building's metered Energy Use Intensity (EUI) — the actual energy consumption measured in kWh/m². This chart also includes a "No heating data" category for buildings where heating data is unavailable. Comparing this chart to the Official EPC Count quickly reveals where actual performance diverges from the official label.
Energy Use Intensity: Official vs Metered A scatter plot that plots each building's official EPC EUI (x-axis) against its metered EUI (y-axis), both in kWh/m². The dashed diagonal line represents where the two values would be equal. Points above the line are buildings that consume more energy in practice than their official rating suggests; points below are performing better than rated. Dots are colour-coded by metered EPC rating.
The EPC Data Table
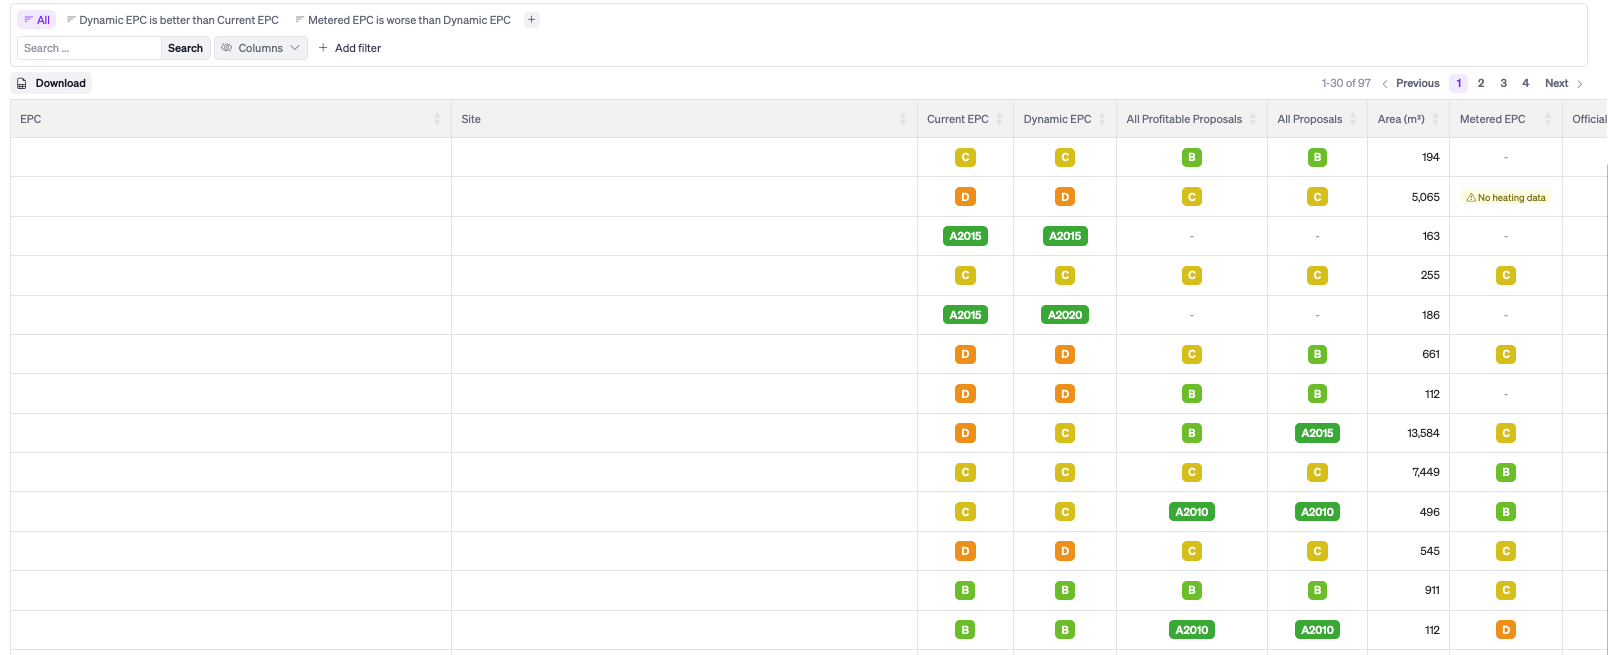
Scrolling below the charts reveals the full data table. Each row represents one EPC (a building or zone).
You can customise which columns are shown by clicking the Columns button above the table. Click Download to export the current view as a file. The table is paginated, and the total count (e.g. "1–144 of 144") is shown at the top right.
Filtering and Searching
Above the table you'll find several tools for narrowing down the data:
- Search bar — type a building name or address to filter rows in real time
- Pre-built filter tabs — two tabs appear by default:
- All — shows every building in the portfolio
- Metered EPC is worse than Current EPC — instantly filters to buildings where measured performance is worse than the official certificate claims
- EPC Comparison filter — a dropdown that lets you set a comparison condition (e.g. "Metered EPC is worse than Current EPC")
- + Add filter — add custom filters for any column (rating, area, tags, EUI thresholds, etc.)
The Planning Views
The planning section helps you identify which buildings to prioritise and which projects to plan, with live estimates of expected savings and investment.
Portfolio Planning
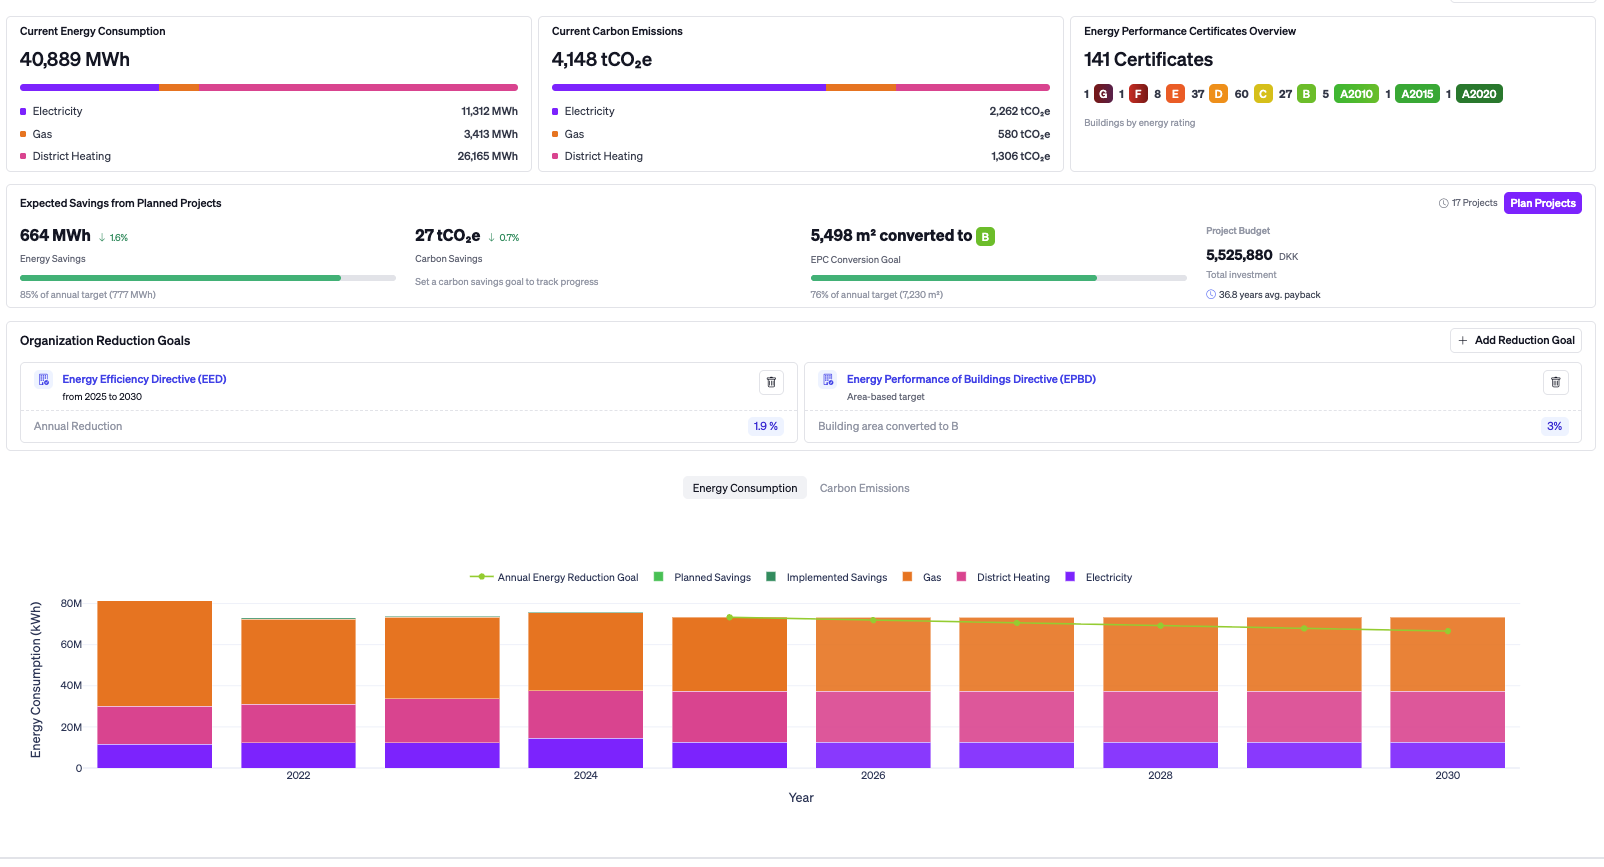
The Portfolio Planning view (accessed via the Planning icon in the left nav) gives an organisation-wide summary of where you stand and what your planned projects will achieve.
Key sections include:
- Current Energy Consumption — total MWh across your portfolio, split by energy type (Electricity, District Heating, etc.)
- Current Carbon Emissions — total tCO₂e, split by energy type
- Energy Performance Certificates — total certificate count with a mini breakdown by rating
- Expected Savings from Planned Projects — live totals for Energy Savings (MWh), Carbon Savings (tCO₂e), EPC Conversion Goal (m² converted to B or better), Project Budget, Total Investment, and average payback time. These update as you plan or remove projects.
- Organization Reduction Goals — set and track portfolio-wide reduction targets. Click + Add Reduction Goal to define a target (for example, the built-in EPC Rating Improvement goal tracks the EPBD requirement of getting 3% of EPCs worse than B up to a B rating).
- Energy Consumption / Carbon Emissions chart — a stacked bar chart by year showing Planned Savings, Implemented Savings, and consumption by energy type. Toggle between Energy Consumption and Carbon Emissions views.
- All Planned Projects — a summary table of every project currently in the plan across all sites.
Click Plan Projects to go to the EPC Planning workflow and start building or updating your plan.
Planning — Building Selection
The EPC Planning page is the starting point for building a project plan. The page is split into two parts:
Top section — live metrics As you select buildings below, the top metrics update in real time:
- Energy Savings and % of annual target
- Carbon Savings and % of annual target
- EPC Conversion Goal (m² converted to B) and % of annual target
- Project Budget, Total Investment, and average payback time
Bottom section — building table A table of all buildings, and connected data.
Check the boxes next to the buildings you want to include in your plan. You can also use the Meet your reduction goals (see below) to auto-select buildings that meet specific criteria.
Once you've selected your buildings, click Choose Projects → in the top right to proceed to the Select Projects step.
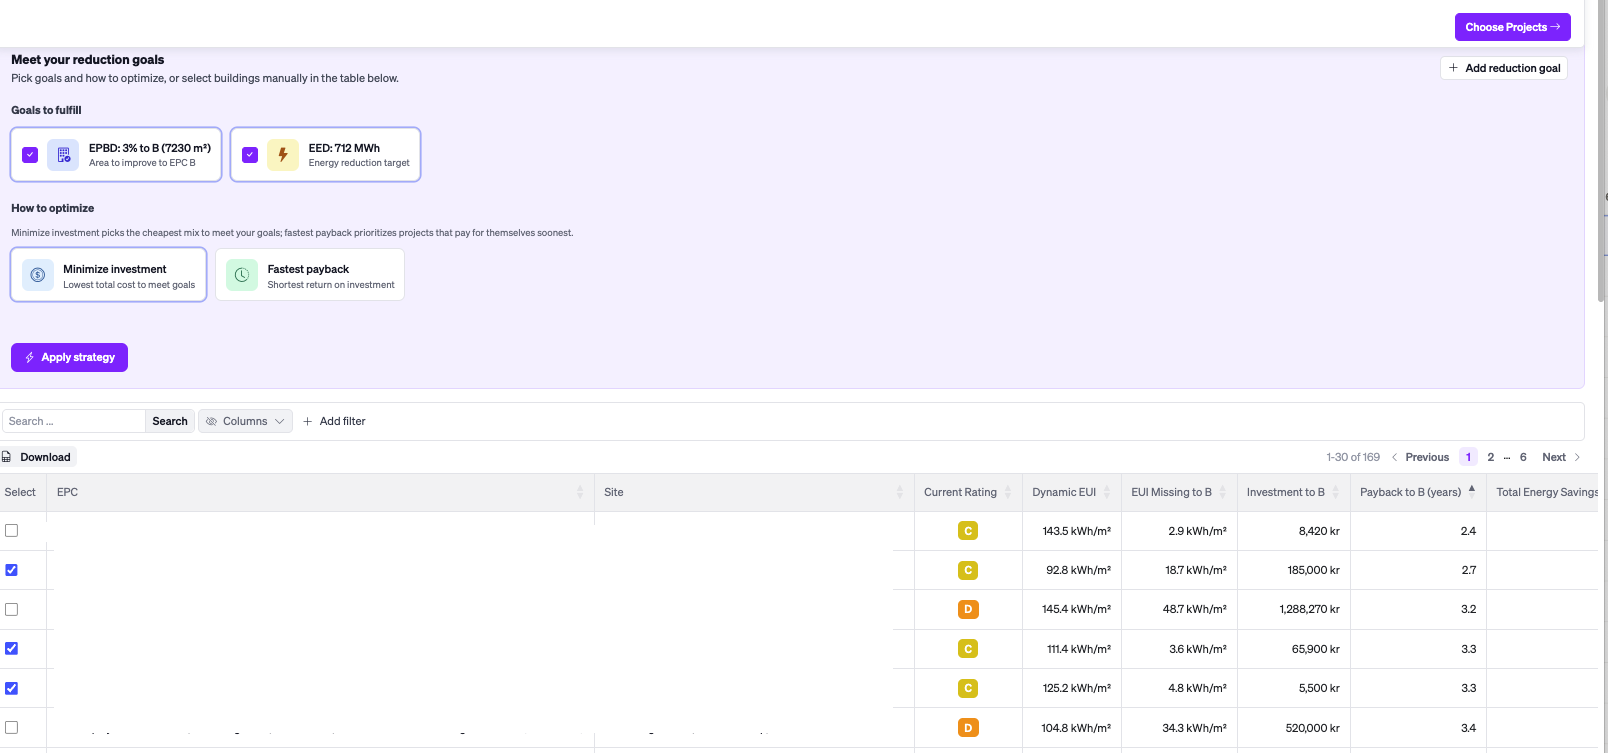
Meet reduction goals
At the top of the building table, the Meet your reduction goals section provides simple auto-selection options. Go to +Add reduction goal, and either add a manual goal or add a goal based on regulations. For regulations there are 2 predetermined goals.
- Energy Performance of Building Directive— selects the combination of buildings that reaches the 3% B-rating goal with the lowest total investment
- Energy Efficiency Directive — 1.9% Portfolio energy consumption reduction each year
Clicking one of these strategies immediately selects the relevant buildings and updates the live metrics at the top of the page. You can then adjust manually from there.
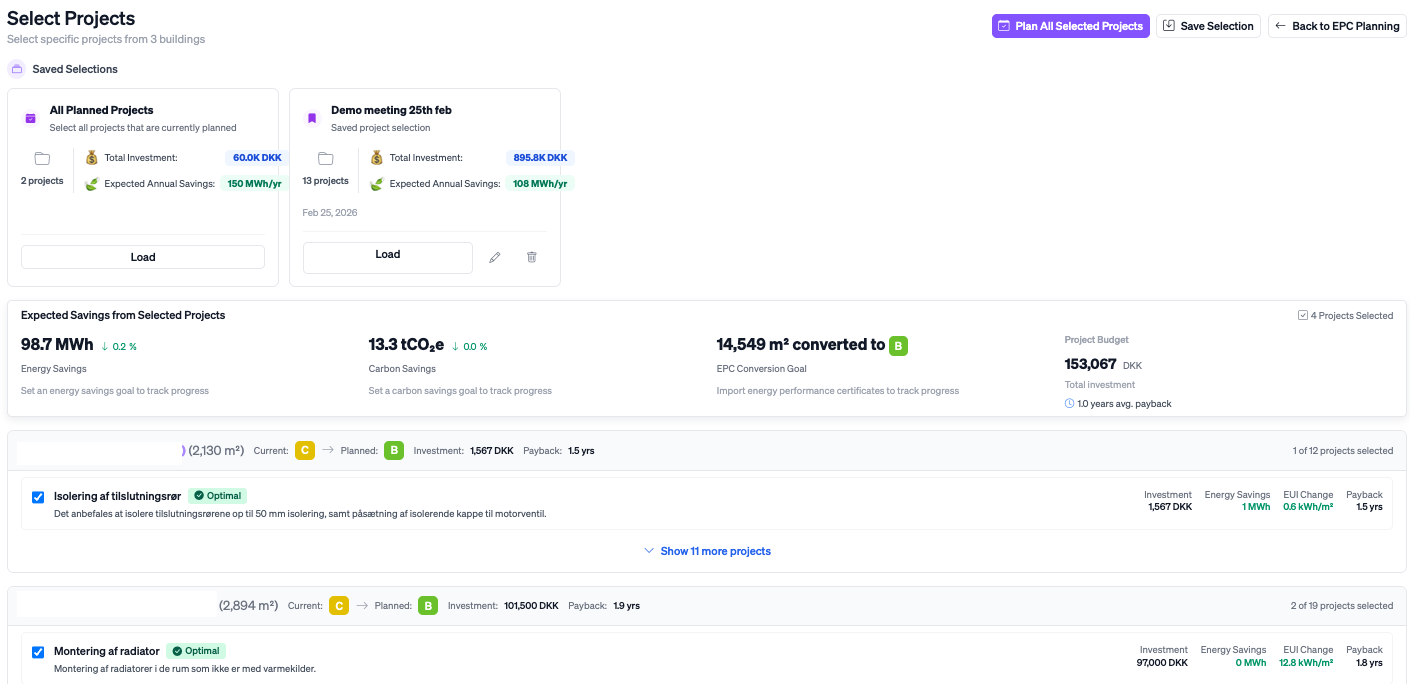
Select Projects
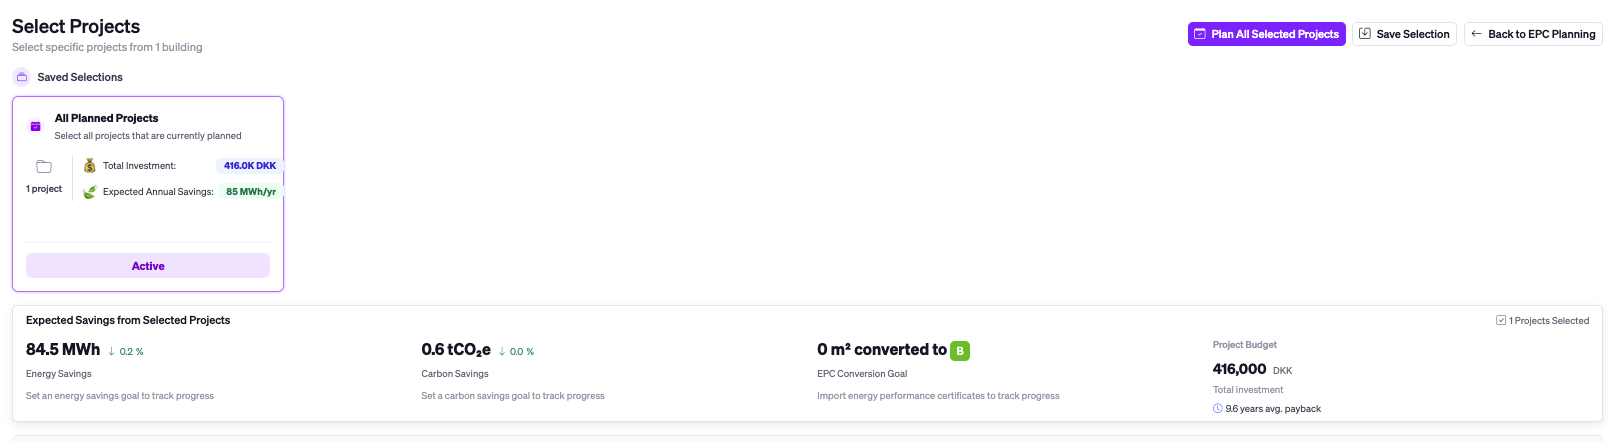
After choosing your buildings, you land on the Select Projects page. Here you can review and customise exactly which improvement projects to include for each building.
For each selected building, Ento shows:
- The building name, floor area, current EPC rating, planned EPC rating, total investment, and average payback
- A list of specific proposed projects (e.g. Optimering af ventilationsanlæg — Ventilation system optimisation), each showing:
- A checkbox to include or exclude it
- An Optimal badge (where applicable — indicating Ento's recommended pick)
- A Planned badge (if the project was previously planned)
- Investment, Energy Savings, EUI Change, and Payback figures
- A description of the recommended action
- A "Show more projects" link to expand the full list of available projects for that building
At the bottom of the page, a Projects from Other Buildings section, lists projects from buildings you did not select above, ranked by profitability. You can still add individual projects from this list to your plan without having to go back and select the entire building.
When you're happy with your selection, click Plan All Selected Projects at the top right to finalise the plan.
Saving and Loading Selections
At any time on the Select Projects page, you can save your current building and project selection for later use. A Saved Selections panel at the top of the page shows any previously saved snapshots.
To save a new selection:
- Select your buildings and projects as desired
- Click Save Selection (available from the Saved Selections panel)
- Give the selection a name (e.g. "High Priority Buildings Q1") and optionally add a description
- Click Save
Saved selections show the total investment, expected annual savings, the date saved, and the number of projects. Click Load to restore a selection, or use the edit and delete icons to manage saved selections. The currently active selection (used in Portfolio Planning) is labelled Active.
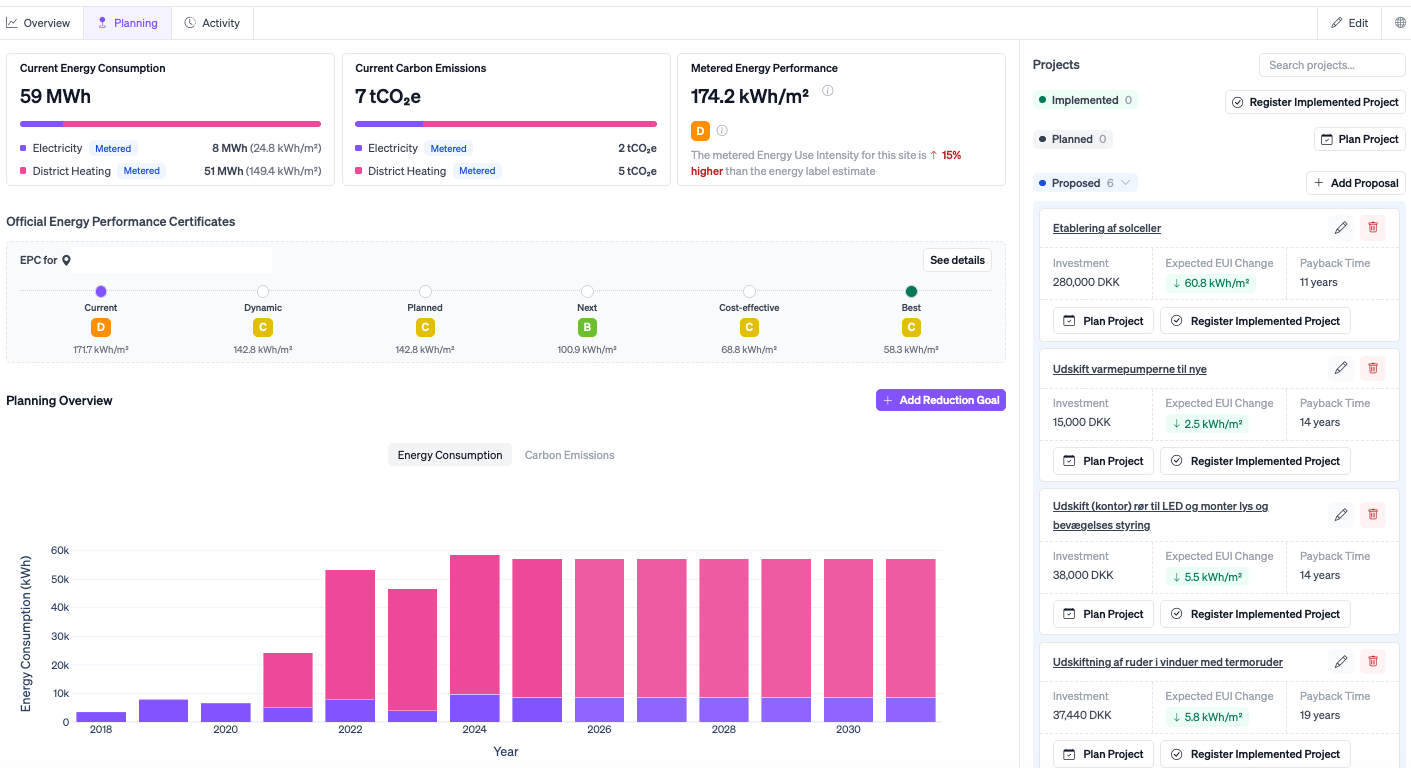
Site-Level Planning
In addition to the portfolio-level EPC tools, each individual site has its own dedicated planning view, accessible by navigating to Sites, selecting a building, and clicking the Planning tab.
The Planning Tab
The Planning tab for a site is available on site level and can be found next to the site overview. It shows:
- Current Energy Consumption (MWh), split by energy type with Metered labels
- Current Carbon Emissions (tCO₂e), split by energy type
- Metered Energy Performance — the site's current EUI in kWh/m², with a note comparing it to the official EPC estimate (e.g. "29% lower than the energy label estimate")
The EPC Timeline
Below the headline metrics, the Official Energy Performance Certificates section shows which EPC(s) apply to the building, and a visual timeline of EPC ratings across six scenarios:
| Stage | Description |
|---|---|
| Current | The building's current official EPC rating and EUI |
| Dynamic | The projected EUI based on current metered data trends |
| Planned | The rating that will be achieved if all currently planned projects are implemented |
| Next | The rating that would result from implementing the next most impactful project |
| Cost-effective | The best rating achievable using only profitable projects |
| Best | The best possible rating if all proposed projects are implemented |
This timeline makes it easy to understand the gap between where the building is now and where it could realistically get to.
The Projects Sidebar
On the right side is the Projects panel, which lists all energy improvement projects associated with the site, organised into three categories:
- Implemented — projects that have already been completed. Click Register Implemented Project to log a new one.
- Planned — projects currently in the plan. Click Plan Project to add a new planned project.
- Proposed — suggested projects not yet planned or implemented. Click + Add Proposal to add a custom proposal.
Each project card in the sidebar shows the investment, expected EUI change, and payback time, along with Plan Project and Register Implemented Project buttons.
Registering an Implemented Project
To record an energy improvement, click Register Implemented Project in the Projects sidebar. And you will be asked to register an action.